Using pagespeed insights to check the performance of your website is quite a good idea. Nobody likes their website visitors to have a poor browsing experience. Pagespeed insights can be used to identify issues with your website, and addressing these can lead to improved performance metrics, better rankings, a better user experience, and more value from your website due to these factors.
What are pagespeed insights?
Pagespeed insights is a free tool from Google that analyses the performance of a website in both desktop and mobile device browsers.
PageSpeed insights provides a detailed report on how quickly a page loads, how efficiently it runs, and how user-friendly it is, using real-world data from the Chrome User Experience Report (CrUX) as well as lab data from Lighthouse.
The PageSpeed Insights tool not only gives an overall performance score but also highlights specific Core Web Vitals—such as Largest Contentful Paint (LCP), First Input Delay (FID), and Cumulative Layout Shift (CLS)—that directly impact user’s browsing experience and ranking positions in search engine results.
Alongside these metrics, pagespeed insights offers practical recommendations, and links to respective resources, to help website owners optimise their website load times, improve usability, and improve SEO performance.
Do the metrics in pagespeed insights matter?
This is a debateable point. Nobody knows (for sure) the degree to which pagespeed insights affects ranking in search engine results. Google themselves say that website performance is a ranking factor, but how prevalent this factor is, and how it’s weighted against other factores isn’t explicitly stated.
The metrics in pagespeed insights do directly reflect how real users experience your website. Nobody likes a slow loading website, and nobody likes trying to click on page elements that move around as the page is loading. Pagespeed insights measures both of these (LCP and CLS respectively).
Google places a strong emphasis on Core Web Vitals, such as loading speed, interactivity, and visual stability when evaluating site quality, and these factors also influence search engine rankings to a degree.
Poor performance scores can lead to higher bounce rates (visitors leaving your site), reduced engagement (fewer repeat visitors), and potentially lower visibility in search results, should a competitor’s site perform better than yours.
By paying attention to the metrics highlighted in pagespeed insights, you can identify specific issues that slow down your site and take action to improve them, ultimately creating a faster, smoother, and more reliable browsing experience for your visitors.
In reality pagespeed insights is there to help. What it helps with most is improving the browsing experience of visitors, and this, and the improvement can help your site rank better… to a degree… we hope.
What does pagespeed insights measure?
PageSpeed Insights measures a combination of performance, accessibility, best practices, and SEO factors that affect how well a website functions for users.
At its core, it focuses on key speed-related metrics known as Core Web Vitals, which are:
Largest Contentful Paint (LCP)
LCP measures loading performance; Specifically how long it takes from the page being requested, to the largest part of the page displayed in the browser being displayed (or “drawn” or “rendered”).
First Input Delay (FID)
FID measures interactivity; This measures the time between when a user first interacts with a page (for example, clicking a link, tapping a button, or using a custom JavaScript-powered control) and when the browser is actually able to begin processing that event.
Cumulative Layout Shift (CLS)
CLS measures visual stability. Roughly speaking, this measures how far elements move around on the screen and how much space those movements affect while the page is rendering.
In addition to these, pagespeed insights evaluates other technical aspects such as server response times, render-blocking resources, image optimisation, and caching efficiency.
The tool presents this data using both lab results (simulated tests) and field data (real-world user data), giving a complete picture of how a site performs under different conditions. This helps website owners pinpoint what’s slowing their website down and take targeted steps to improve overall performance and user experience.
Pagespeed insights is essentially measuring how well your web pages perform in a bowser. This is based on your site’s page output, and how long it takes for page output being received, rather than how well your WordPress performs as an application.
The tool presents this data using both lab results (simulated tests) and field data (real-world user data), giving a complete picture of how a site performs under different conditions. This helps website owners pinpoint what’s slowing their website down and take targeted steps to improve overall performance and user experience.
The difference between pagespeed insights and Chrome’s Lighthouse facility.
While pagespeed insights uses real world data from the Chrome User Experience Report (cRUX) to show how your site has performed for actual users over the past 28 days, Chrome’s built-in Lighthouse tool provides a more immediate, lab-based analysis of your site’s current performance.
This means that pagespeed insights reflects historical trends and averages, giving insight into how your optimisations impact real users over time, whereas Lighthouse in Chrome lets you test changes in real time and see the immediate effect of tweaks like image compression, caching, or code minification.
For WordPress site owners, this makes Lighthouse in Google Chrome especially useful for verifying whether recent optimisation efforts are working as intended before relying on historical PageSpeed Insights data.
Using pagespeed insights or Chrome’s Lighthouse facility to analyse your website.
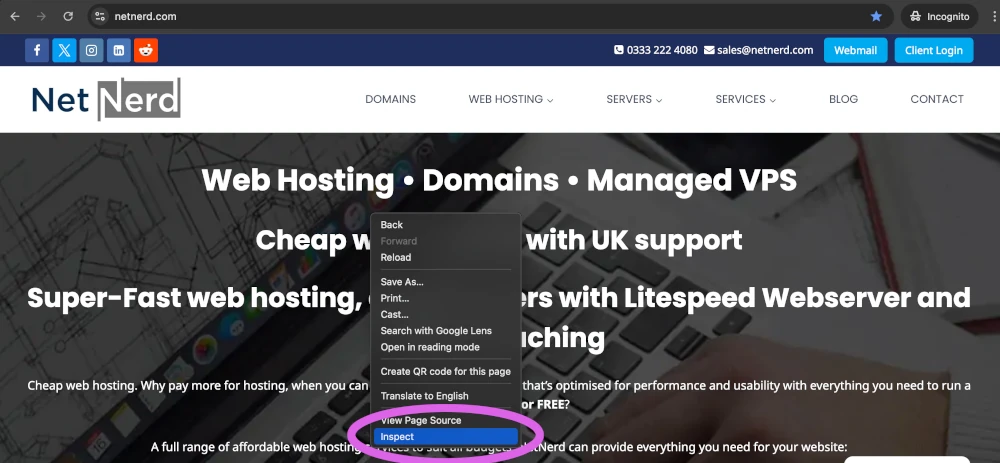
If you haven’t already done so, install Google Chrome, then open it. It’s advisable to use an incognito window when analysing your site.
Browse to your website, then right click on the page, and click “inspect”:
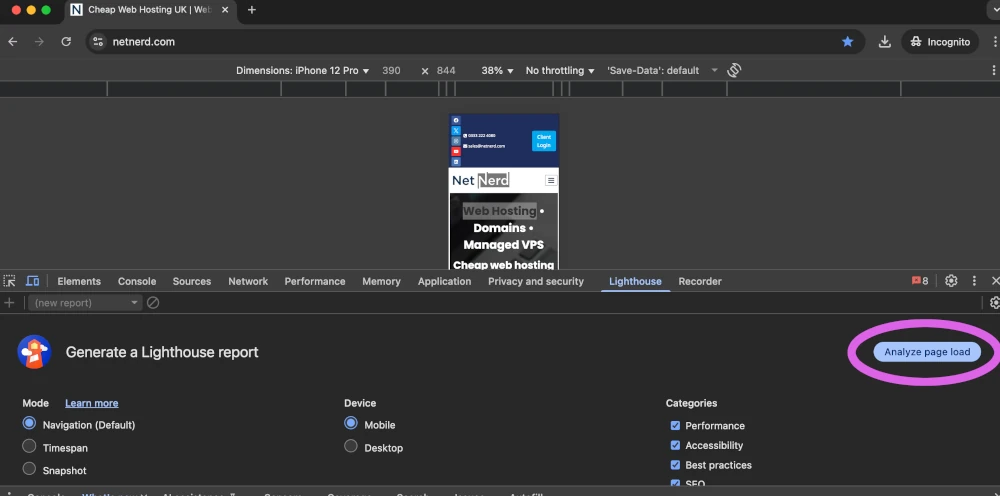
This will open Chrome’s developer tools. Within developer tools, click the “Lighthouse” heading:
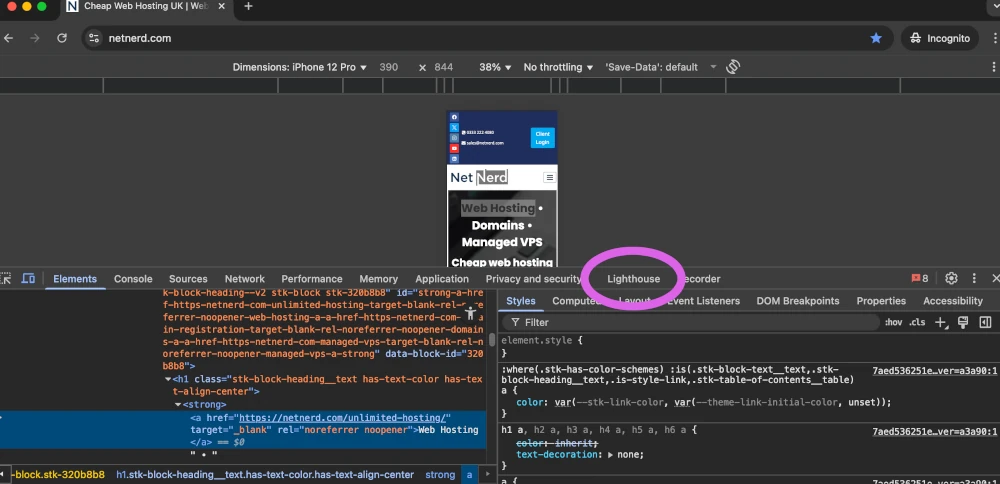
You’d then click the “Analyze page load” button to run the lighthouse report, which is the “in browser” equivalent of pagespeed insights. Don’t navigate away from the page when the report is running.
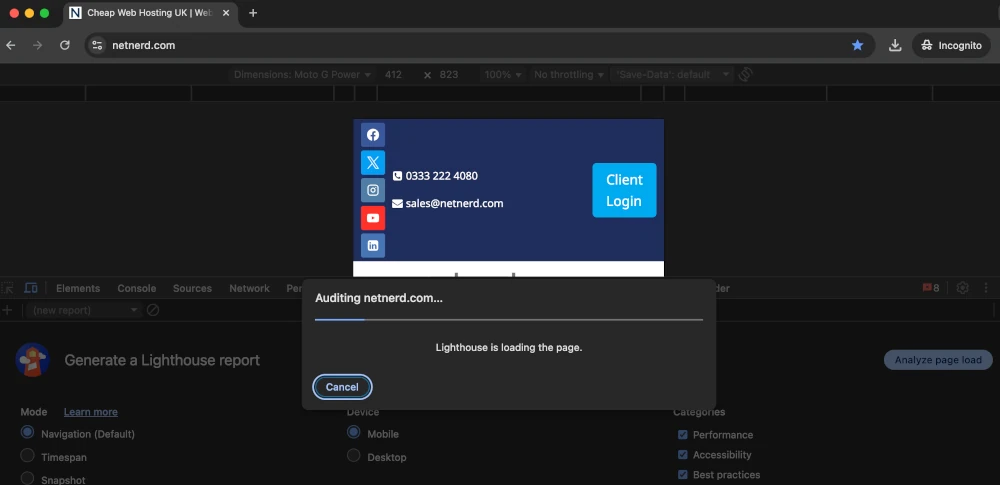
The lighthouse analysis then starts:
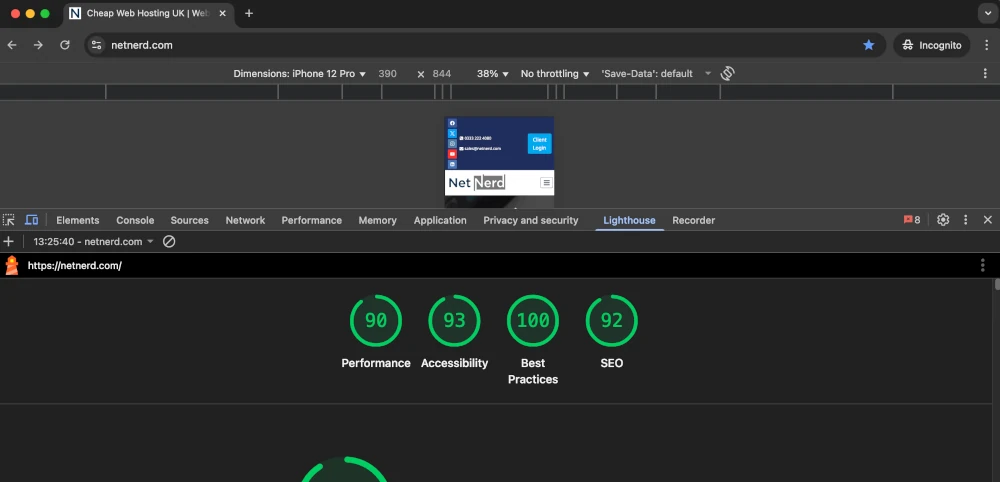
And then the results are displayed:
And if I scroll down I can see some “insights”. On the same line as each insight there’s a small arrow:
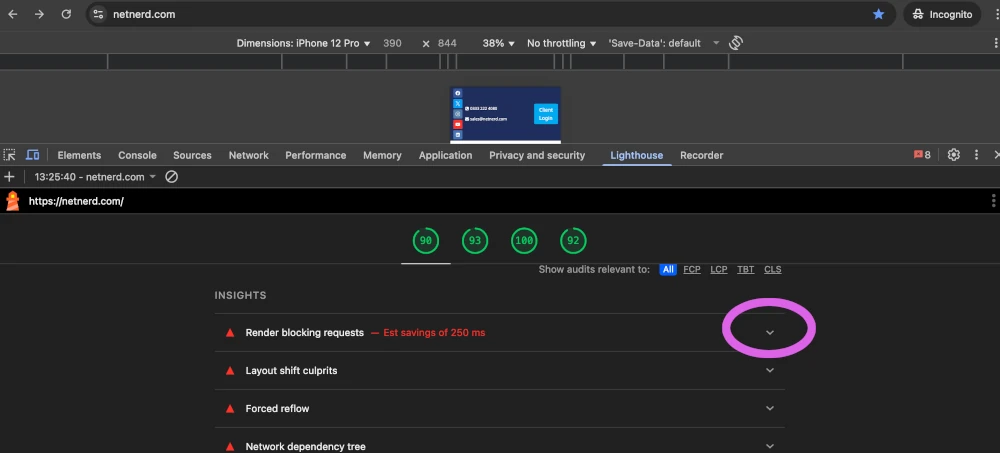
Clicking the arrow shows a lot more detail about render blocking resources:
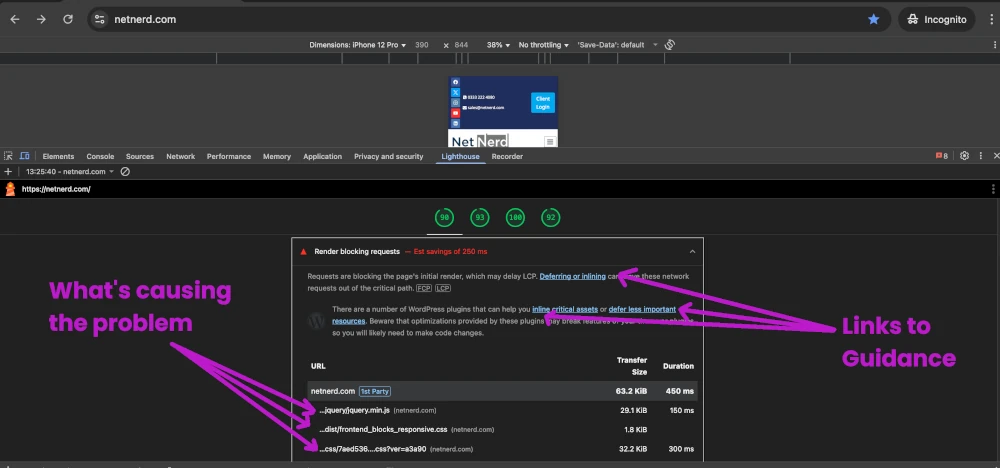
This section is very handy. Initially it’s advisable to read the guidance that’s linked to, so that you understand what the problem is. You then have to work out how to address this in your WordPress. Unfortunately, due to the variable nature of WordPress, there’s no specific “this is how you fix the problem” type guidance, you have to work it out, try and address it, then use lighthouse to run another test to see if the situation has improved. Guidance covering some common issues is linked to below.
In my case, I’ve taken the required action in my WordPress and I’ve just run a lighthouse report to see if my performance metric has improved:
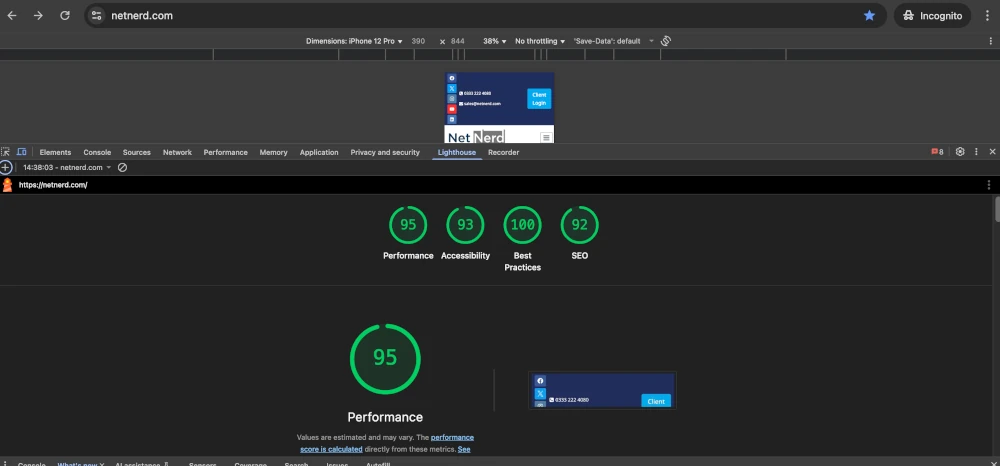
As you can see, I now have a performance metric of 95 (this was previously 90) so it looks like the situation has improved. To check this I’m going to expand the render blocking resources section, and see if there are the same number, or less render blocking scripts:
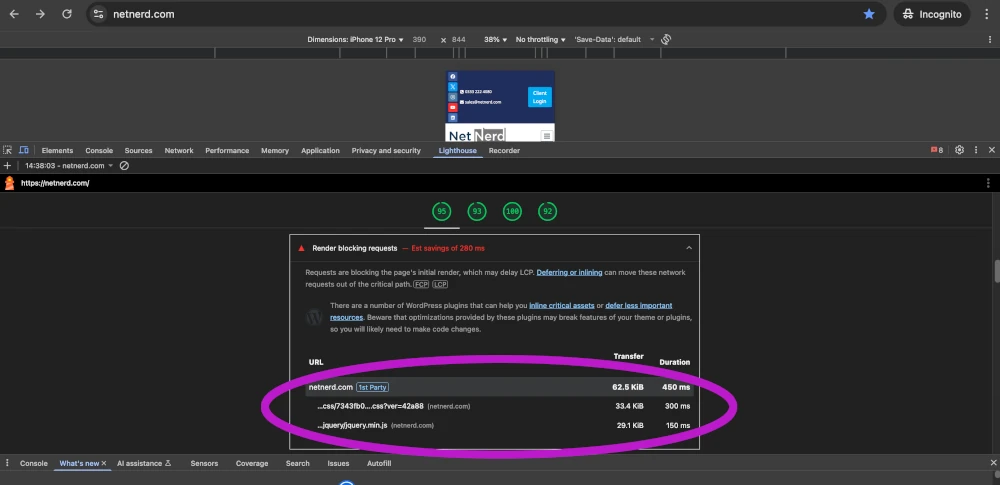
As you can see there are now only two render blocking scripts, where as there were 3 present previously.
I think it’s safe to say that I’ve gained a performance increase of 5% by eliminating one render blocking script. Go me.
Although I’ve dealt with only one aspect of one issue, the methodology to deal with others is roughly the same:
- Analyse the page with Chromes Lighthouse facility.
- Expand the “insight” and read the information that’s linked to to understand the problem.
- Work out how to address the problem in your WordPress.
- Validate you have addressed the problem by analysing the page with Chromes Lighthouse facility.
- Is the performance metric now acceptable? Yes: You’re done. No: Go back to step 1.
Common problems flagged by Lighthouse
Lighthouse undertakes a A LOT of audits, so there can be a lot of different issues flagged.
Reduce initial server response time
Hosting can play a role in this. Ensuring your hosted somewhere that provides object caching, the litespeed web server HTTP/3, compression, and opcache helps a lot with this. All shared web hosting packages from netnerd.com offer these. Using object caching or deploying a caching plugin can both also help with this.
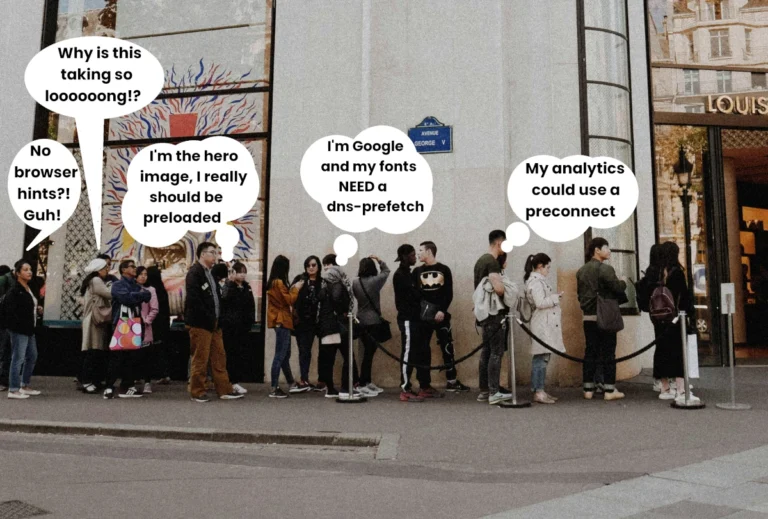
Eliminate render blocking resources
Render blocking resources case delays in the page loading process so can add to FCP and LCP metrics. You can find guidance covering how to deal with render blocking resources here. If your google fonts are render blocking you can either preconnect to Google fonts, prefetch DNS or localise google fonts.
Minify and combine JavaScript and CSS
Minifying makes files smaller, and combining reduces the number of files needed to render a page. You can find guidance covering how to eliminate render blocking resources here.
LCP request discovery
You can use browser hints to tell the browser to preload LCP images, which starts them loading sooner in the page loading process, which helps reduce LCP time. You can find guidance covering how to preload LCP images here.
Improve image delivery / serve images in next-gen formats
Images take up quite a large proportion of data transfer in web pages, so optimising them is key to a well performing website. You can find guidance covering optimising images in WordPress here.
FAQ: Pagespeed insights: How to improve performance score.
What are PageSpeed Insights?
PageSpeed Insights is a free tool from Google that analyzes how quickly a webpage loads and how user-friendly it is on both desktop and mobile devices. It uses real-world data from the Chrome User Experience Report (CrUX) and lab data from Lighthouse, providing performance scores, Core Web Vitals (LCP, FID, CLS), and practical recommendations for improving speed, usability, and SEO.
Do the metrics in PageSpeed Insights matter?
Yes, the metrics matter because they reflect how users experience your site. Core Web Vitals measure loading speed, interactivity, and visual stability. Poor scores can lead to higher bounce rates, lower engagement, and reduced search visibility. By addressing the issues highlighted, you can improve performance, user experience, and potentially search rankings.
What does PageSpeed Insights measure?
PageSpeed Insights measures Core Web Vitals—Largest Contentful Paint (LCP), First Input Delay (FID), and Cumulative Layout Shift (CLS)—as well as other factors like server response time, render-blocking resources, caching, and image optimization. It uses both lab tests (simulated) and field data (real-world) to provide a complete picture of page performance.
What is the difference between PageSpeed Insights and Chrome’s Lighthouse?
PageSpeed Insights uses historical real-world data from cRUX, showing performance trends over the past 28 days, while Lighthouse in Chrome provides real-time, lab-based performance analysis. Lighthouse is especially useful for testing whether recent optimisations such as image compression or caching—have improved page speed immediately.
How can I use Lighthouse to improve my WordPress site?
Open your site in Chrome, right-click and select “Inspect,” then go to the “Lighthouse” tab. Run the analysis to see performance metrics and actionable insights. Expand each insight to understand issues like render-blocking resources or slow server response, implement fixes in WordPress, and re-run Lighthouse to check improvements. Repeat until your performance score is satisfactory.
What common problems does Lighthouse flag, and how can I fix them?
Common issues include:
- Slow server response: Improve hosting, use caching plugins, enable compression, and leverage HTTP/3 or opcache.
- Render-blocking resources: Minify and combine JavaScript and CSS, preload important fonts, or localize Google Fonts.
- Slow LCP or large images: Preload LCP images and serve images in next-gen formats (WebP/AVIF).