WordPress and Core Web Vitals. What Core Web Vitals are, why these are important to consider, and pass. How each core web vital can be measured and improved. How the hosting you choose can affect how easy it is to pass Core Web Vitals. You don’t need to spend a lot to be able to carry out these actionable optimisation steps, our cheap WordPress website hosting (currently £1 per month for the 1st 6 months, then £4.99 plus VAT thereafter) provides object caching, opcache and the Litespeed Web Server by default.
What are Core Web Vitals?
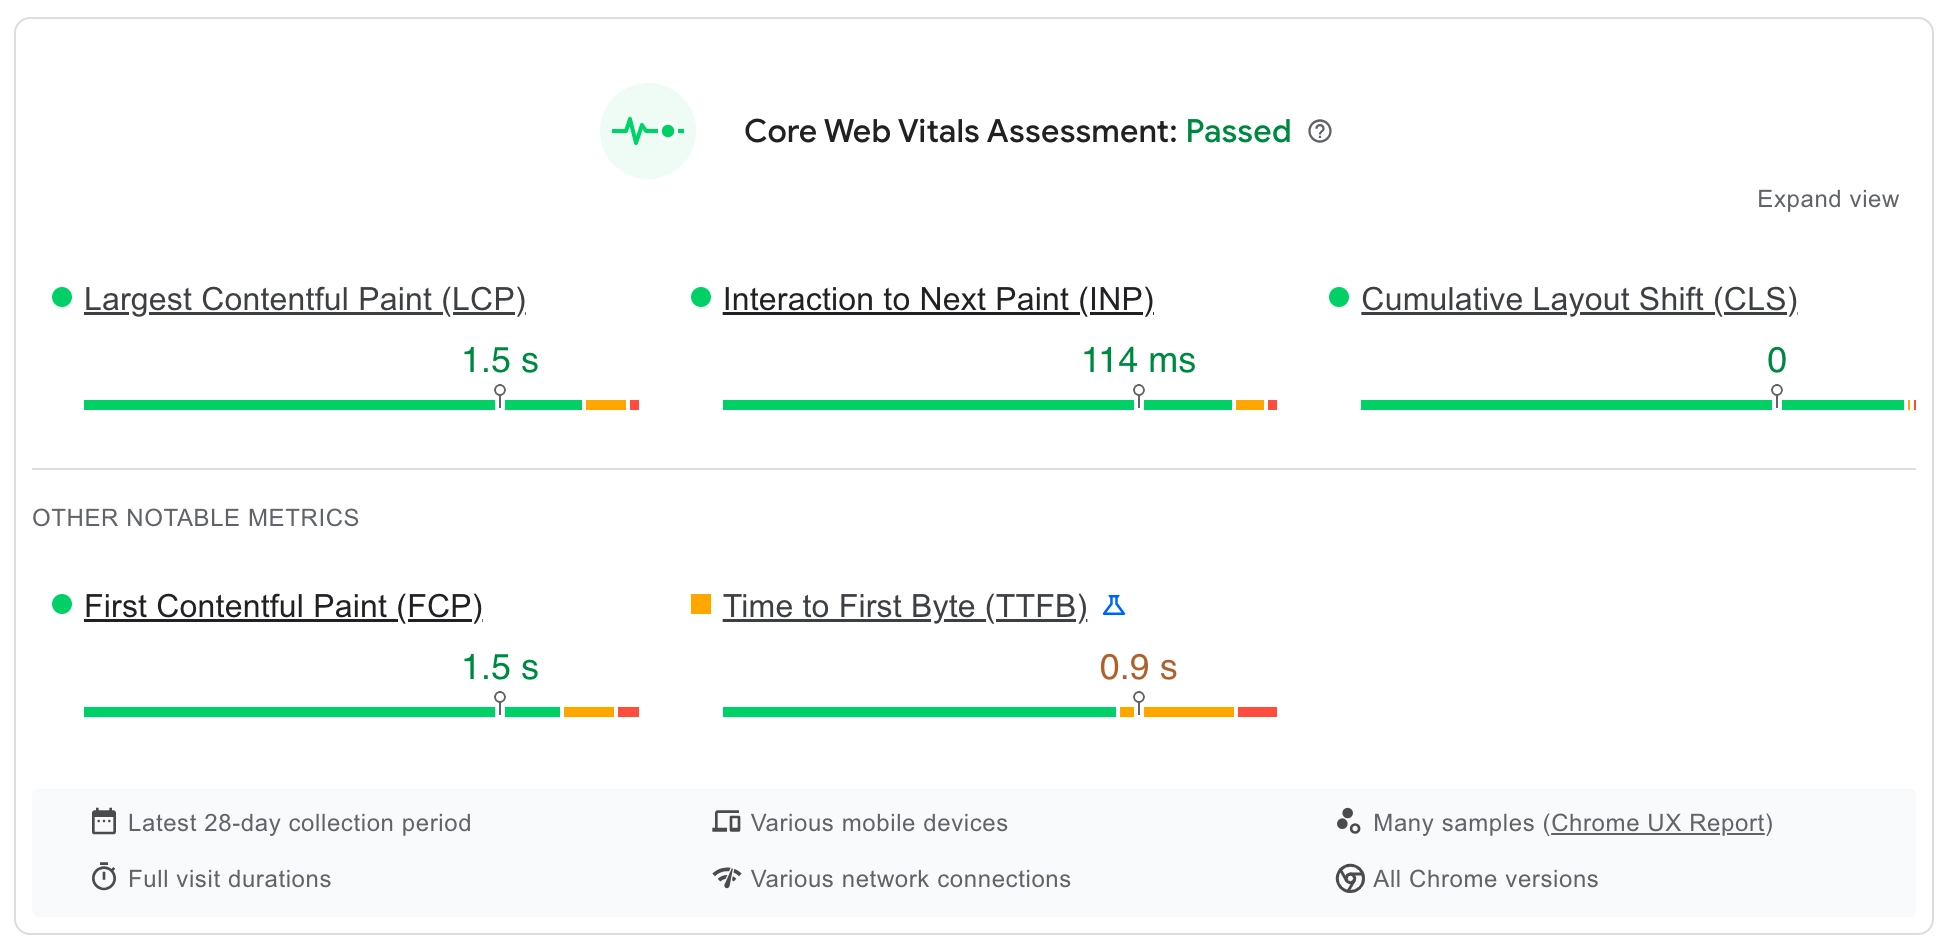
Core Web Vitals are a collection of metrics used by Google to asses the performance of your website. Google use Core Web Vitals as a ranking factor, so how well your website performs (or how badly) can affect the position of your website in Google search results.
Core Web Vitals are a collection of metrics which are used to measure a visitors experience when they visit your website. These metrics are Content Layout Shift (CLS), Interaction to Next Paint (INP), and First Contentful Paint (FCP). I’ll also be talking about Largest Contentful Paint (LCP) and Time To Fist Byte (TTFB) in this post, as they also relate to your website’s performance.
Why Core Web Vitals are an Important Consideration.
Your website’s Core web vitals, as mentioned above, can affect how your website ranks in Google search results.
Core Web Vitals extend beyond ranking alone, as these collectively are an assessment of how well your site performs from a visitor’s perspective.
Your Core Web Vitals being good will usually tend to result in longer engagement times (less closing the browser because the page is taking too long to load), and passing Core Web Vitals can even improve sales if you’re running an online store.
Passing Core Web Vitals isn’t just some kind of nerdy box ticking exercise to keep Google happy, it actually improves the experience your site’s visitors have when browsing your website.
Content Layout Shift (CLS)
Content Layout Shift (CLS), is when elements on the page move around as the page loads. We’ve all seen it where a web page looks like it’s loaded, and you go to click on a link or a button, then it moves. How annoying. This is CLS that’s causing this annoyance. CLS has a relationship with how your website handles CSS (cascading stylesheets). The de facto advice for CSS is:
Inline critical CSS and defer non critical assets.
What this means in English is “put the CSS required for the initial draw of the page in the HTML of the page itself, and put the other CSS in CSS files that can be called later in the page loading process”. By putting the CSS required for the initial draw in the page’s HTML, it both stops CLS, and prevents what’s called render blocking CSS.
Render blocking CSS is CSS that’s needed to for the initial draw of the page that isn’t obtained soon enough in the page loading process. Because the CSS is needed to draw the page, but there’s a delay in this being obtained, this causes the drawing of the page itself to be delayed.
At this point a train of thought might occur that’s along the lines of “why not just inline all the CSS?”. The problem with doing this is that this would also cause an unnecessary delay, because CSS is being loaded early in the page loading process, but some of this isn’t needed for the initial draw of the page. This is really why you inline what’s needed (Inline critical CSS) and load the part that’s not needed for the initial draw for later in the page loading process (defer non critical assets).
By inlining critical CSS, and deferring non-critical CSS, you’ll prevent CLS.
How CLS is measured.
A layout shift score is calculated by comparing the difference between two rendered snapshots of a page image. What differs between the two is used to work out what moves and by how much these elements move. The two are then multiplied together to get a CLS score.
A good CLS score is 0.1 or below (not much moving!). 0.1 to 0.25 is considered “needs improvement” and a score about 0.25 is considered bad.
Tools such as https://webvitals.dev/cls can be used to check your site’s CLS.
You can also use Google’s Page Speed Insights to check CLS.
How to improve Content Layout Shift (CLS)
Improving CLS involves effectively inlining critical CSS and deferring non critical assets.
Luckily there’s a plugin called autoptimize you can use to inline critical CSS and defer non critical assets.
To make use of the autoptimize plugin, you’d simply install and activate this plugin, then tick these options:
- Optimize CSS Code
- Aggregate CSS-files
- Also aggregate inline CSS
- Eliminate render-blocking CSS
There are some additional tuning options available should the above have undesired effects, but usually the above will cover most scenarios. If you only use these options in the autoptimize plugin, you can use this plugin alongside other caching and optimisation plugins.
If you have a problem with your site’s CLS this can often be caused by optimising your CSS before carrying out the above (inlining critical CSS).
If you install a caching plugin and enable CSS minify (remove whitespace and comments to reduce file size) and combine (to combine multiple CSS files into a single file), then defer your CSS, you’re likely to cause some CLS. This is because you’re putting ALL your CSS in one single file, and delaying its load until after the page HTML has been loaded. The CSS being applied after the HTML has been loaded causes a “readjustment” of the page when the deferred CSS is applied, which is what results in CLS.
Inline first, then optimise, and you’ll reduce CLS.
Interaction to Next Paint (INP)
Interaction to Next Paint replaced an older metric called First Input Delay (FID). Both of these metrics relate to user interactions and how fast or well something happens as a product of a user interactions.
What’s being measured here is really how long it takes for something to happen when someone clicks on something on a page. Put in real world terms, if you click on a “buy” button and the basket icon quickly shows a 1 next to it (to indicate that you’ve added one item to your shopping basket) quickly, that’s good INP. On the other hand, if you click on an accordion item and it doesn’t fully expand or takes a long time to expand, that’s poor INP.
The coded that’s used to handle these interactions is called JavaScript. This is (to summarise) code that’s run within the browser, to change how something appears or is displayed. Some of the most common uses for JavaScript are:
- Expanding the mobile menu
- Things changing colour when you hover your mouse over them
- Displaying drop down menus
- Form validation (mandatory fields)
- Google’s recaptcha
How Interaction to Next Paint (INP) is measured.
INP is calculated by checking how long all the interactions made with a page take to complete. The interaction with the most delay is reported as INP in milliseconds, so INP is really a time based metric.
For pages with a high number of potential interactions, the longest interaction out of every 50 interactions is ignored. This is to gain a better overall impression of the page, rather than focus on one or two very long interactions, which is more likely to occur on pages with high numbers potential interactions.
Again Google’s Page Speed Insights can be used to check INP score, as can Debug bear’s INP debugger.
An INP score below 200ms is considered good, 200-500ms needs improvement and above 500ms is considered poor.
How to improve Interaction to Next Paint (INP)
Optimising for INP can be situational depending on your site, and how it functions. That said there are some general actions that can be taken to help with INP. What you’re generally aiming for, is to reduce unused JavaScript, then optimise what remains.
Plugins like the Asset clean up plugin can be used to unload specific JavaScript files should they be included in your site’s page output, but not actually used.
Hosting external JavaScript locally can also help improve INP. Using the CAOS plugin to host your Google analytics tacking code locally, or using the OMGF plugin to host Google fonts locally are both examples of this.
Lazy rendering HTML allows for elements on a page to be skipped during rendering (the draw of the page) until they are actually needed by the user. Plugins such as flyingpress and LiteSpeed Cache both provide this functionality.
Some more generalised techniques include:
- Minifying JavaScript. This reduces the size of JS files by removing whitespace and comments. A lot of caching plugins can be used to do this.
- Combining JavaScript. This effectively merges multiple files in to a singular file. You have to be a bit careful with this as it can break things (check the mobile menu after enabling). This can also help reduce the number of requests involved in a single page load.
- Deferring JavaScript. This delays the execution of JavaScript until after the HTML of the page has been fully loaded. This allows you to load JavaScript files without them causing a delay in page rendering (or drawing).
First Contentful Paint (FCP).
The First Contentful Paint metric is a measurement of time. What’s measured is the time between when the page was requested to when any part of the page’s content is rendered, or drawn, on the screen.
This might sound a little bit like the time between a page being requested, and page output being generated but that’s a different metric called TTFB (time to first byte), which I’ll come to later.
Both FCP and TTFB are affected by how long it takes for your WordPress to generate page output. In addition FCP is affected by what’s in the page output, where as TTFB isn’t affected by this.
Although FCP and TTFB are related, FCP is more along the lines of TTFB + page output being received + page output beginning to be rendered by the browser. A longer TTFB results in a longer FCP time.
Optimising for FCP involves making page output that can begin to be rendered faster, rather than making your WordPress start generating page output faster.
How First Contentful Paint (FCP) is Measured.
FCP is measured in time. What’s measured is the time between when the page was requested to when any part of the page’s content is rendered, or drawn, on the screen.
Again Google’s Page Speed Insights can be used to check INP score, as can Debug bear’s Website Speed Test.
An FCP time of 1.8 seconds or below is considered good, 1.8 to 3.0 needs improvement, and 3.0 or above is considered poor.
How to improve First Contentful Paint (FCP).
There are quite a lot of individual tasks you can carry out to improve FCP.
Reducing your TTFB will also reduce your FCP time, but I’ll come to TTFB later.
Eliminating render blocking resources to prevent delays in the page draw (or render) starting. This is touched on above the CLS section. Inlining critical CSS, and deferring non critical assets helps prevent render blocking resources. Deferring JavaScript also helps with render blocking.
Caching plugins tend to provide a lot of facilities that help with FCP time:
- Removing unused CSS
- Minifying CSS (to reduce the size of CSS being transferred)
- Defining a caching policy for static assets
Preconnecting to required origins helps with the loading of external resources, but you might not need to do this if you’ve already localised your JavaScript (as in the INP section).
There’s also an element of being sensible that helps with FCP such as not using really big images, or having lots of HTML elements on pages.
Largest Contenful Paint (LCP)
Largest contentful paint is another time measurement. What’s measured is the time between the page being requested, and the time it takes to draw (or render) the largest part of the page.
LCP is similar to FCP as it involves drawing (or rendering) part of the page. The difference between FCP and LCP is that FCP measures the time from request to first render, and LCP measures the time from request to the largest draw (or render).
The largest element of the page often involves an image. Images are quite big compared to a page’s HTML so they take longer to download, and can cause a delay in the largest contentful paint.
How Largest Contenful Paint (LCP) is Measured.
Largest contentful paint is another time measurement. What’s measured is the time between the page being requested, and the time it takes to draw (or render) the largest part of the page.
Again Google’s Page Speed Insights can be used to check LCP score, as can Debug bear’s website speed test.
An LCP time of 1.8 seconds or below is considered good, 2.5 to 4.0 needs improvement, and 4.0 or above is considered poor.
Improving Largest Contentful Paint (LCP)
The problem (or delay) with LCP is usually due to the HTML needing to be obtained before the browser can establish which image needs to be downloaded.
Initially optimising the image (making it a suitable size and resolution) for your web page is a good idea as this can reduce the size of the image in bytes. Using image formats such as webp and avif also help reduce the size of the image.
Preloading can be used to tell the browser to start loading the image sooner (before all the HTML has been downloaded) in the page loading process. As the image is downloaded at the same time as the HTML, rather than after, the total download time is reduced, and LCP can take place quicker.
It is possible to preload manually by putting directives in the section of the HTML document.
There’s also a plugin called preload LCP image that does this for you. This plugin allows you to define 2 images to be preloaded (one for desktop one for mobile) in a section at the bottom of pages when viewed in the page editor in WordPress. Once you’ve worked out what your LCP image is, you then select this image using these options.
Some themes, such as the Kadence theme will allow you to set different versions of images, one for mobile and one for desktop, on your site’s pages. This allows you to upload two different images, each optimised for the device used to view the page. You can then select these images on a per device basis using the preload LCP image plugin options.
The net result of this is along the lines of you uploading and inserting images optimised as much as they can be according to device, then inserting these on a per device basis in to your pages. The preload LCP image plugin is then used to prelaod each image, again on a per device basis.
You’re loading the image as soon as you can, and as early in the page loading process as you can, on a per device basis. This helps reduce LCP time.
Time to first byte (TTFB).
Time to first byte is another time based metric. What’s measured with time to first byte is the time between the page being requested and the first byte of page output being received by the browser.
TTFB can be harder to optimise because it involves some components outside your website, such as network latency, how quick DNS lookups complete, how fast the encryption handshake between the browser and the web server takes place.
TTFB is also affected by components inside your WordPress such as how long it takes the site’s PHP to execute, interact with the site’s database and start generating page output. Increased PHP execution time can be caused by things like using a high number of plugins, or a large amount of data in your site’s database.
The other thing about TTFB is that it precedes other metrics, and consequently it affects them as well.
To put this in context, part of your site’s LCP time is taken up by TTFB.
If TTFB = Request for page > DNS lookup > Network latency > Encryption handshake > PHP execution + DB interaction > Page output
Then LCP = All of the above + Page output received, parsed, additional resources requested, paint starts, LCP occurs.
Consequently a slow TTFB gives you slow FCP and LCP. Whilst CLS and INP are more specific to how your page behaves, TTFB, LCP and FCP are all specific to how quickly things happen.
It’s quite important to reduce TTFB as best you can when optimising for core web vitals, as it affects downstream metrics. There’s no point putting a lot of effort in to optimising for LCP if your TTFB is slow.
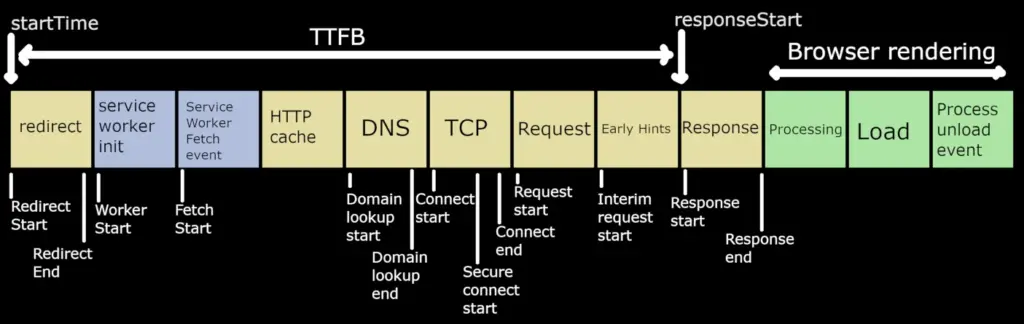
TTFB is the sum of the following request phases:
- Redirect time
- Service worker startup time (if applicable)
- DNS lookup
- Connection and TLS negotiation
- Request, up until the point at which the first byte of the response has arrived
How Time to first byte (TTFB) is Measured.
Time to first byte is another time based metric. What’s measured with time to first byte is the time between the page being requested and the first byte of page output being received by the browser.
You can use Speedvitals TTFB test and Google’s Page Speed Insights to check TTFB. A good TTFB is under 800ms anything between 800 and 1800ms is considered to need improvement and anything above 1800ms is considered poor.
One of the main thing to bear in mind about TTFB is that you don’t control a some of the components that add to TTFB time. For example you don’t control how quickly your ISP’s DNS servers respond, or how fast your internet connection is.
Obviously you do control what’s going on in your hosting such as the PHP version being used, or the amount of plugins that you have installed.
There’s also a grey area with regard to what you do and don’t control, and that’s how the server on which your site is hosted works. Although you don’t directly control the configuration of this server, you can choose who you host with.
Improving time to first byte (TTFB).
You’ve really got four things to consider here. What’s in WordPress, whats in the hosting, the hosting server and the request getting to the server.
In WordPress
You can use plugins such as the code profiler plugin to establish which plugins have long execution times. You might consider removing these. Reducing the number of plugins will also reduce the amount of code being executed.
You can use the Query Monitor plugin to establish what’s causing large amounts of queries, or long queries. Removing the respective components and cleaning the database are both options. You could also use the wp index mysql for speed plugin to add indexes to tables (this makes retrieving data from the indexed tables take less time.
In the hosting
Newer versions of PHP (if your hosting provides a PHP version selector) are usually faster, so these will help with TTFB.
Using compression (this usually involves adding directives to the site’s .htaccess file, many caching plugins provide this facility) reduces the amount of data being transferred. This doesn’t directly help TTFB but can help reduce overall data transfer and therefore page load times.
Making sure that your hosting provides enough RAM and CPU to cover your site’s overhead will also help.
Requests reaching the server
Optimising this tends to involve using a Content Delivery Network (CDN). This becomes more applicable if you’re appealing to a global audience. CDNs provide points of presence across the world, and the request for the site routes to the nearest automatically. This can help reduce latency.
You can also use DNS servers belonging to CDNs to improve DN lookup times. Cloudflare’s DNS is pretty fast, as is Quic.cloud’s.
If you don’t have the need to appeal to a global audience, hosting in the country where your customers are based may be an option. If you’re primarily serving customers in the UK, WordPress website hosting uk is an option for you.
The hosting server
This is a bit of a tricky one, as you don’t have much control over how the server on which you’re hosted is configured, what hardware it’s using, how many accounts the server contains (if it’s shared hosting), or how busy the server is. These factors can influence how long it takes for a server to handle a request for a web page. The server itself can affect TTFB.
How long a WordPress installation takes to start generating page output also contributes to TTFB. Due to this it’s very easy for poor core web vitals to be attributed to the WordPress installation itself, even though both the server and the WordPress installation both contribute to TTFB.
WordPress is quite easy to do badly. It’s really easy to do things that make WordPress slow, without really knowing that it’s what you did in your WordPress that’s caused the slowness. WordPress does need to execute it’s PHP to generate that first byte of page output, so it’s also very easy to point the finger at what’s going on in the WordPress application as the cause of a slow TTFB.
Even the likes of cPanel say “In almost all cases of TTFB being slow, it is due to the Web Application (your site code)”. You can see this here:
CPanel aren’t wrong. A site’s TTFB can be slow due to what’s going on inside the web application (the web application I’ve been talking about is WordPress).
There is, however, the server aspect in addition, and to say “it’s the WordPress” isn’t really giving the full picture of what’s happening.
In the cPanel article linked to above, they suggest testing using a text file as a comparison to the web application. This isn’t really the best way of checking if it’s the web application that’s slow or not. This is because requesting a text file involves a web server and the text file. It doesn’t involve the PHP interpreter (so no spawning of PHP processes).
How long the web server takes to spawn PHP processes can take time, and therefore contribute to TTFB.
If the test cPanel have suggested involved a PHP “hello world” instead of using a text file, this would be much more indicative of whether the slow time is specific to the web application or not, as PHP is used in both tests. The difference between the two tests would be that one executes a line of PHP code (the hello world PHP file) and the other executes an entire PHP based web application.
So let’s do that test.
I’ve created a cPanel account on a server running apache and in it I have:
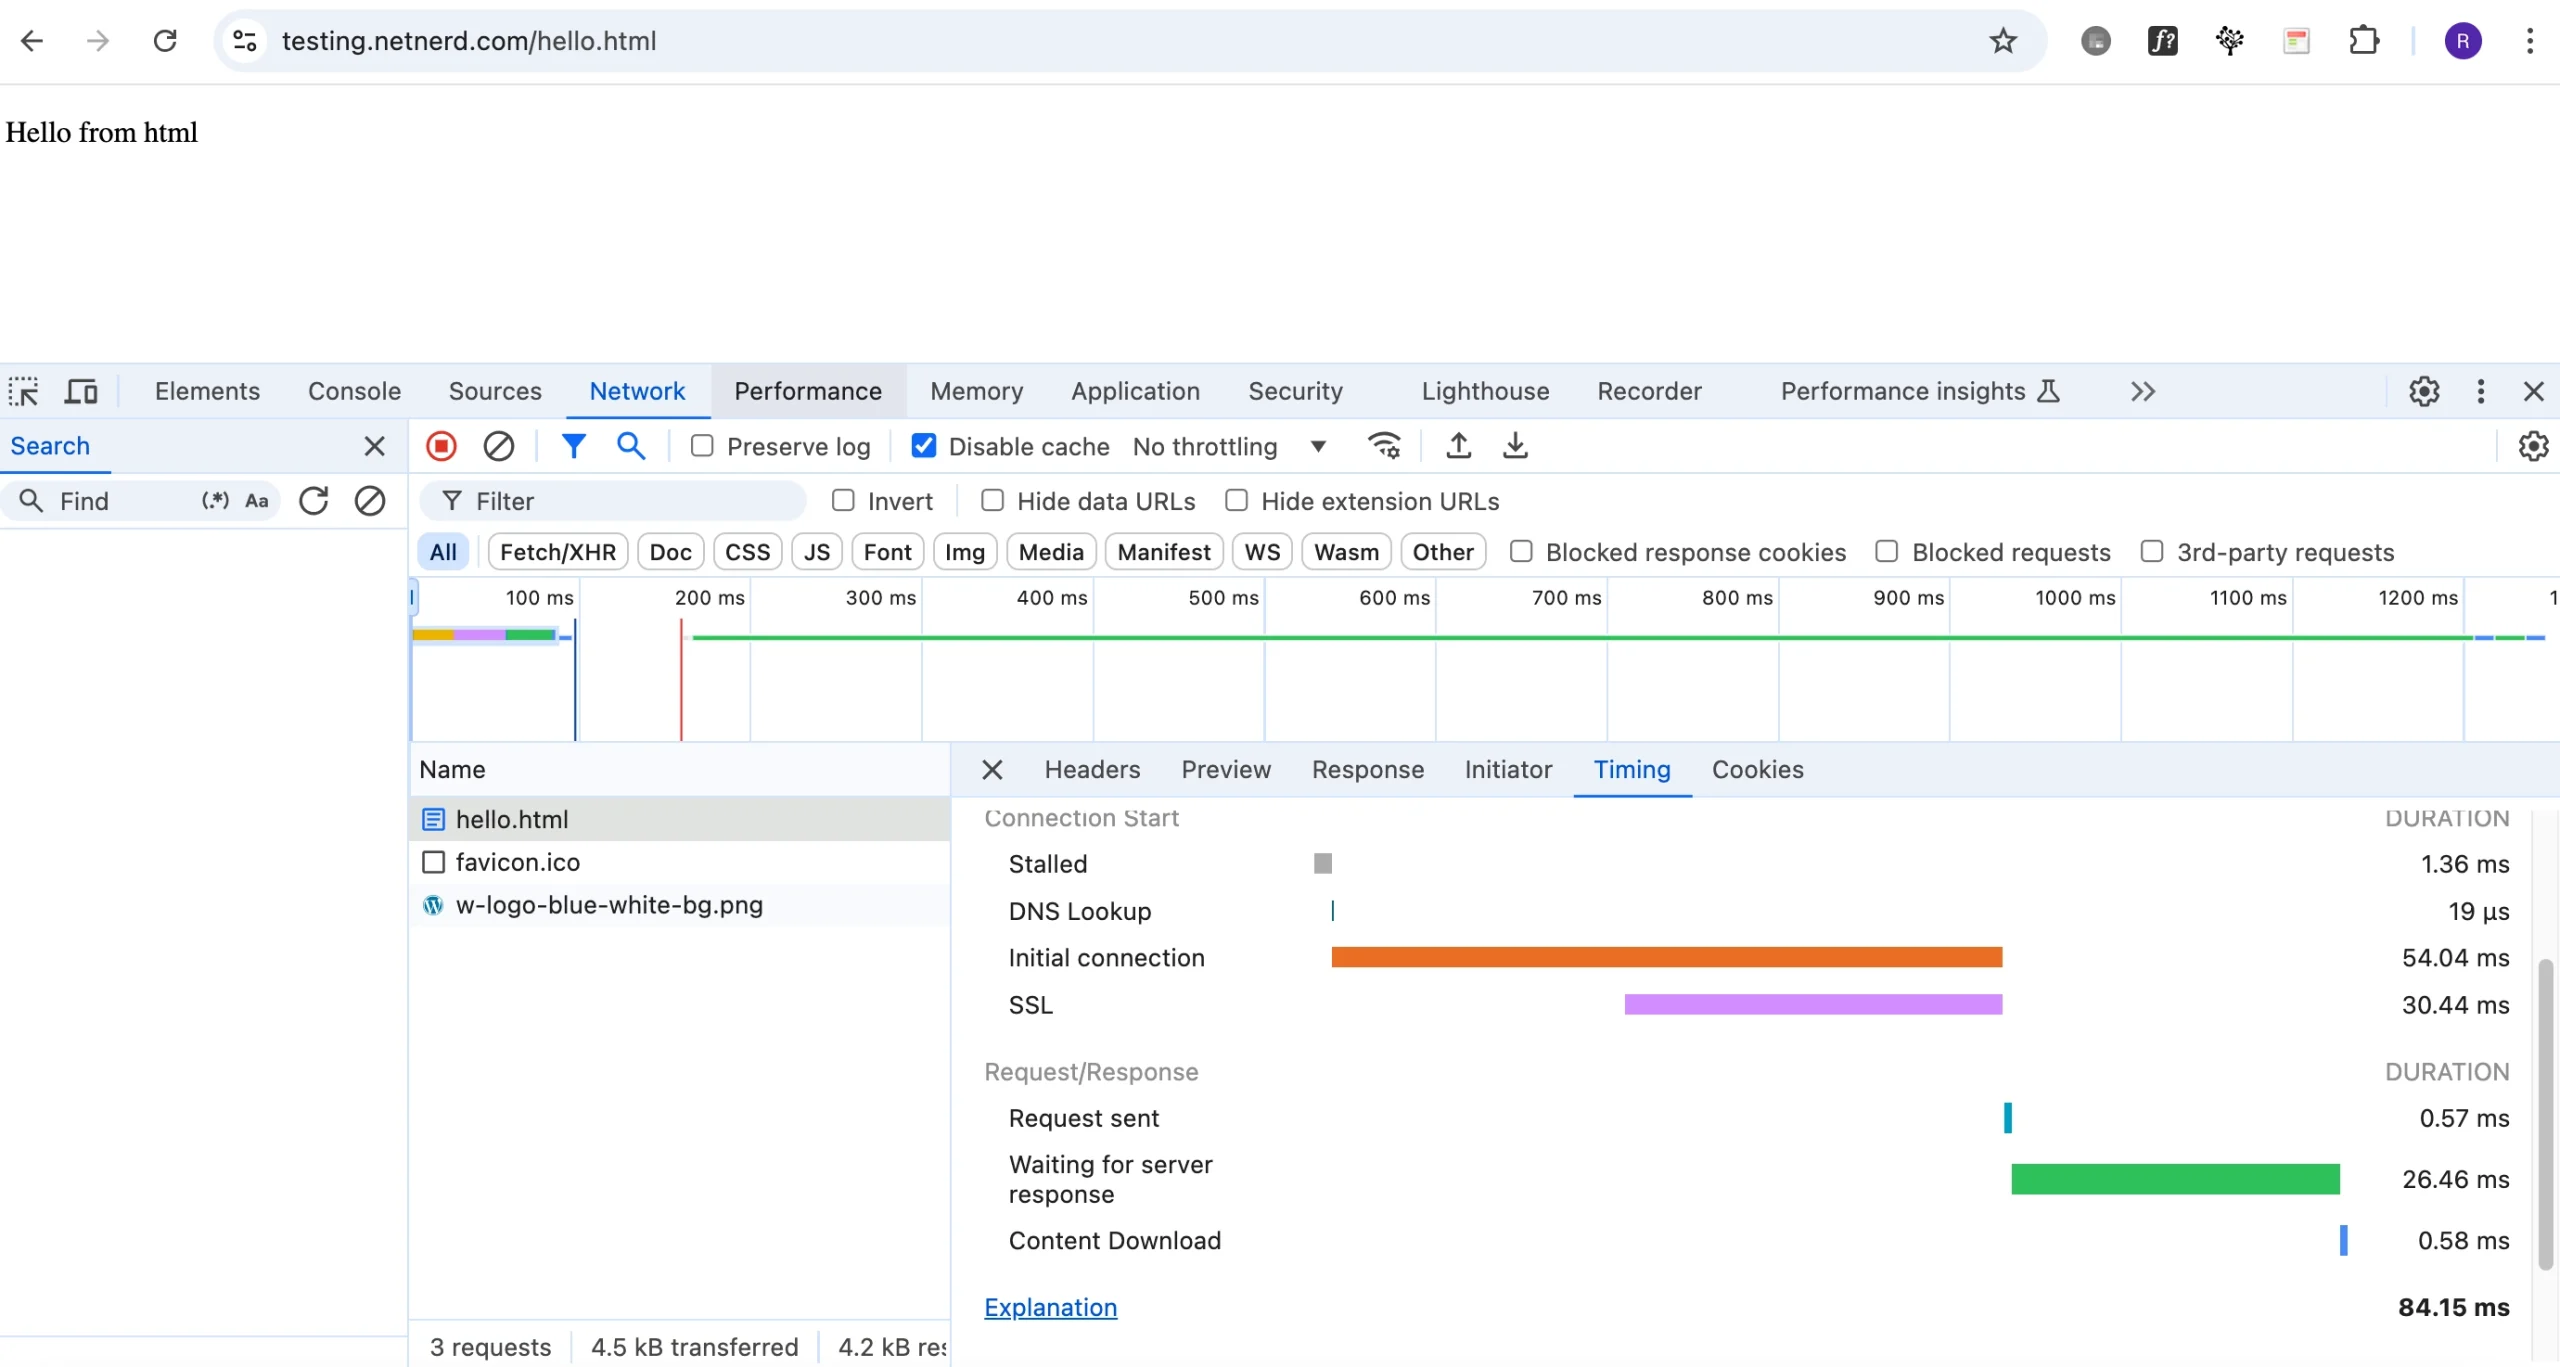
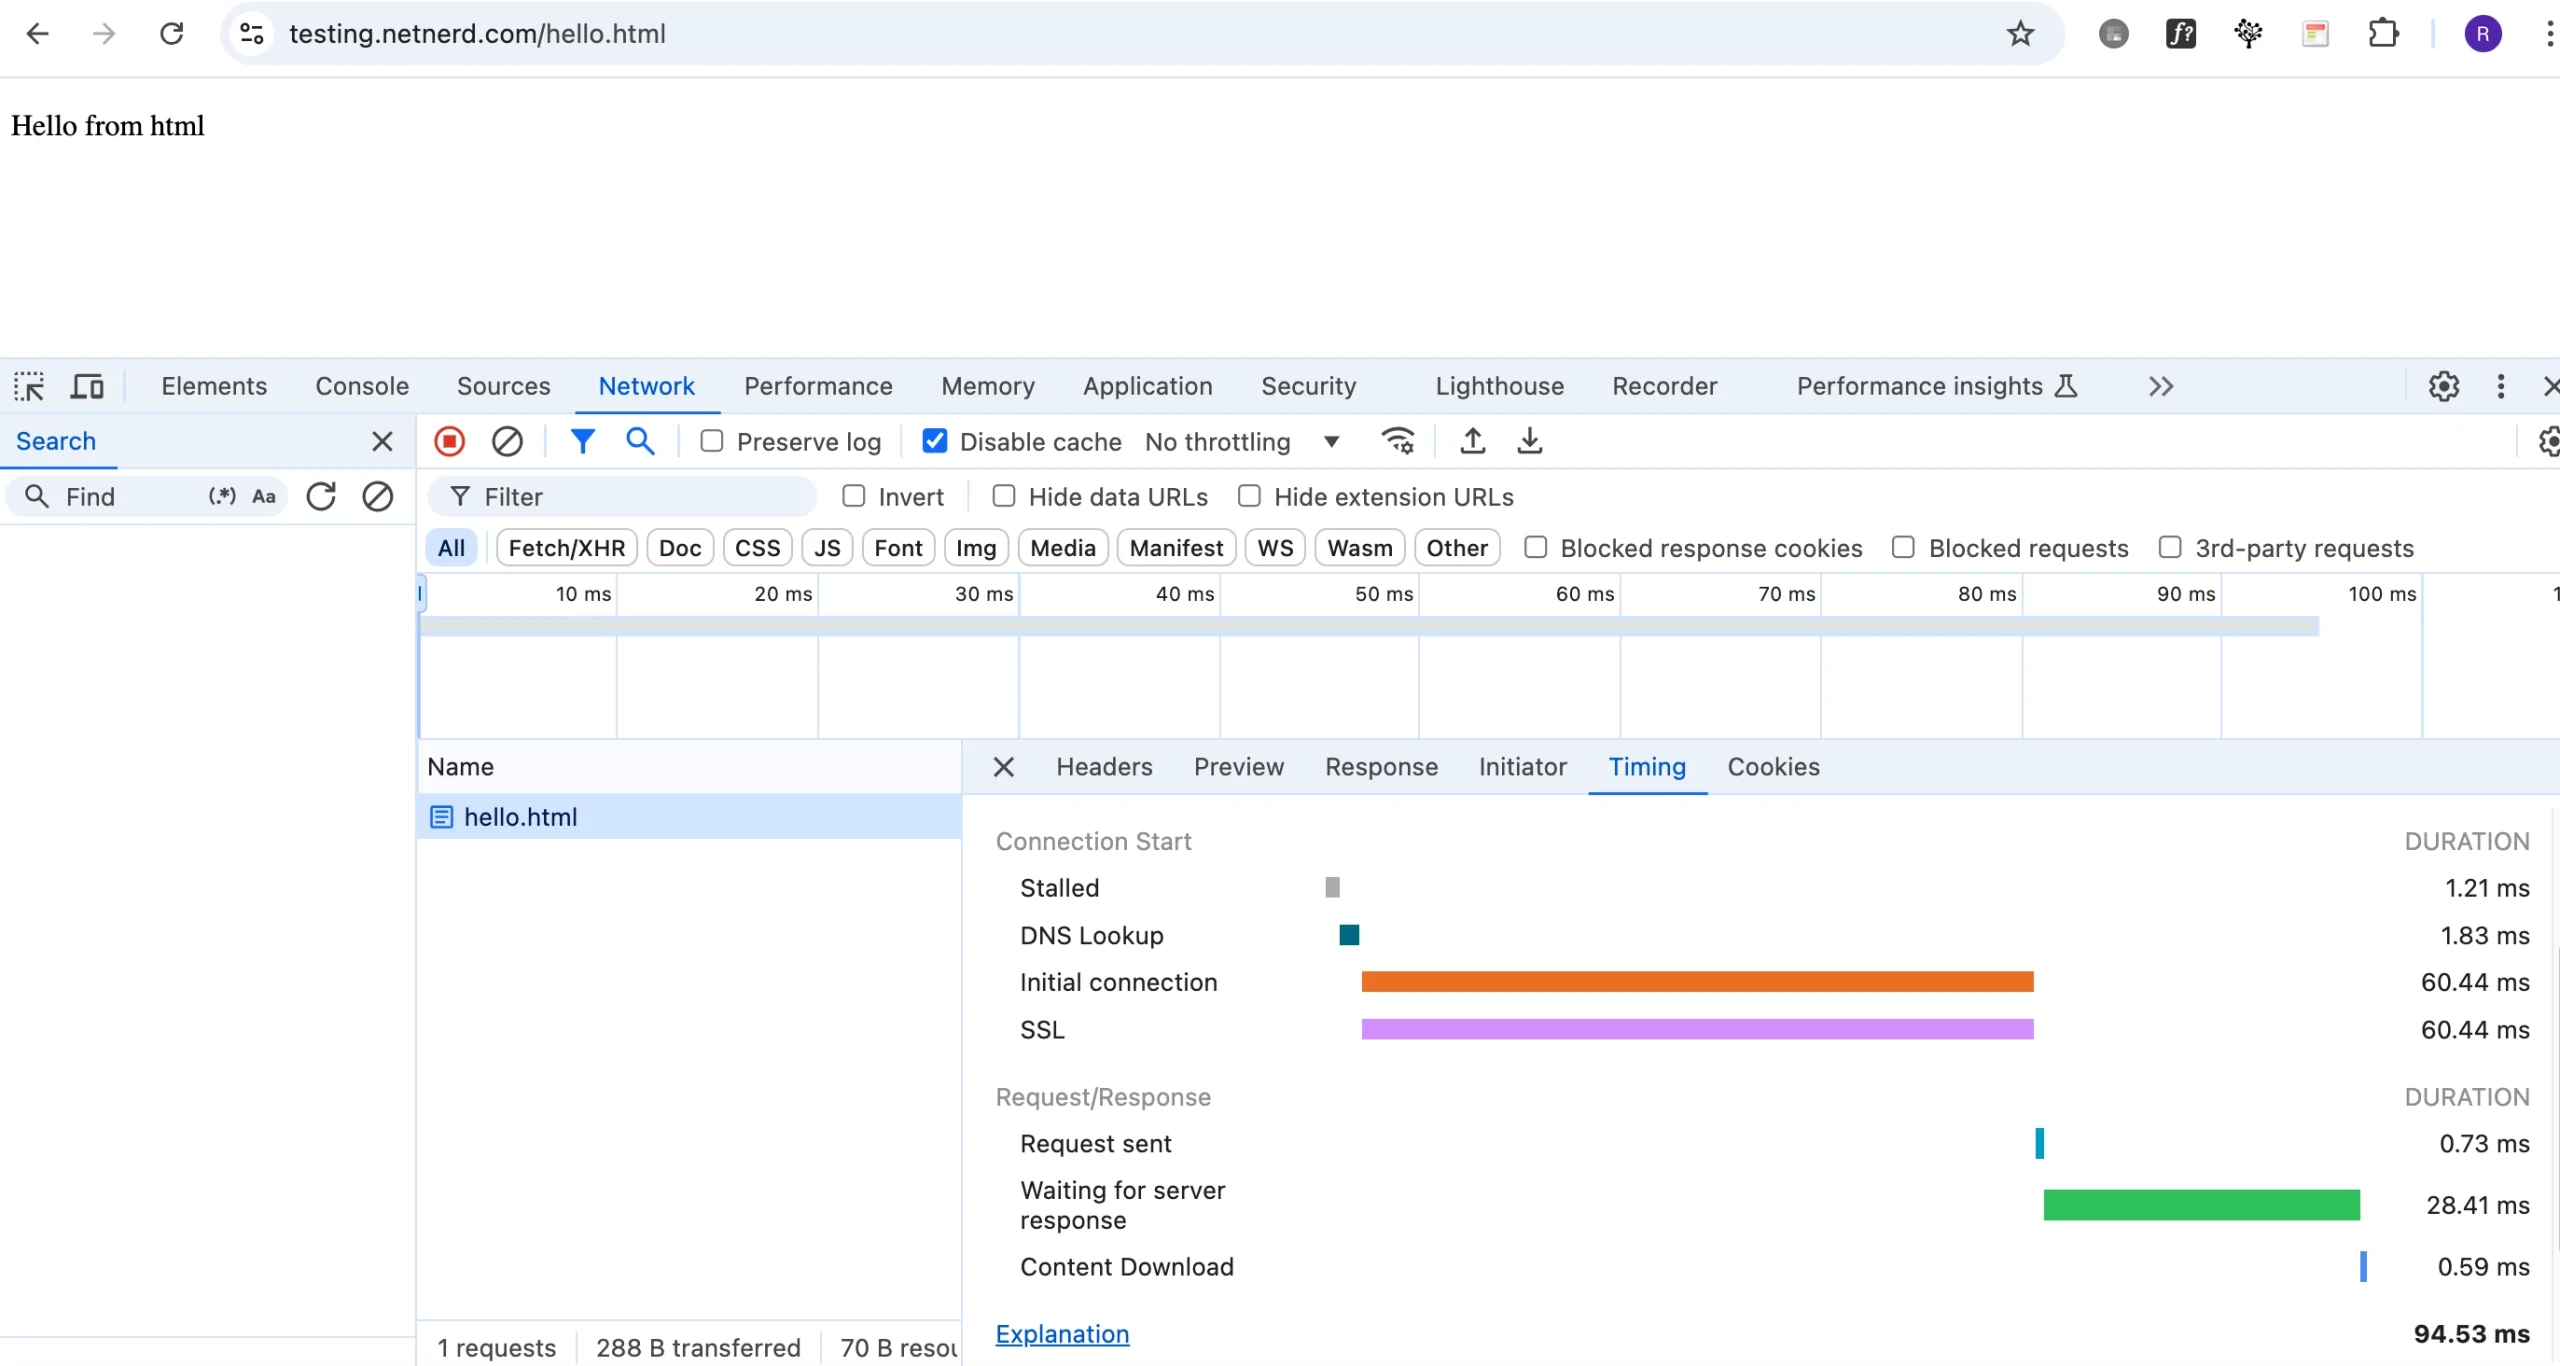
A hello.html containing:
<!DOCTYPE html>
<html>
<body>
<p>Hello from html</p>
</body>
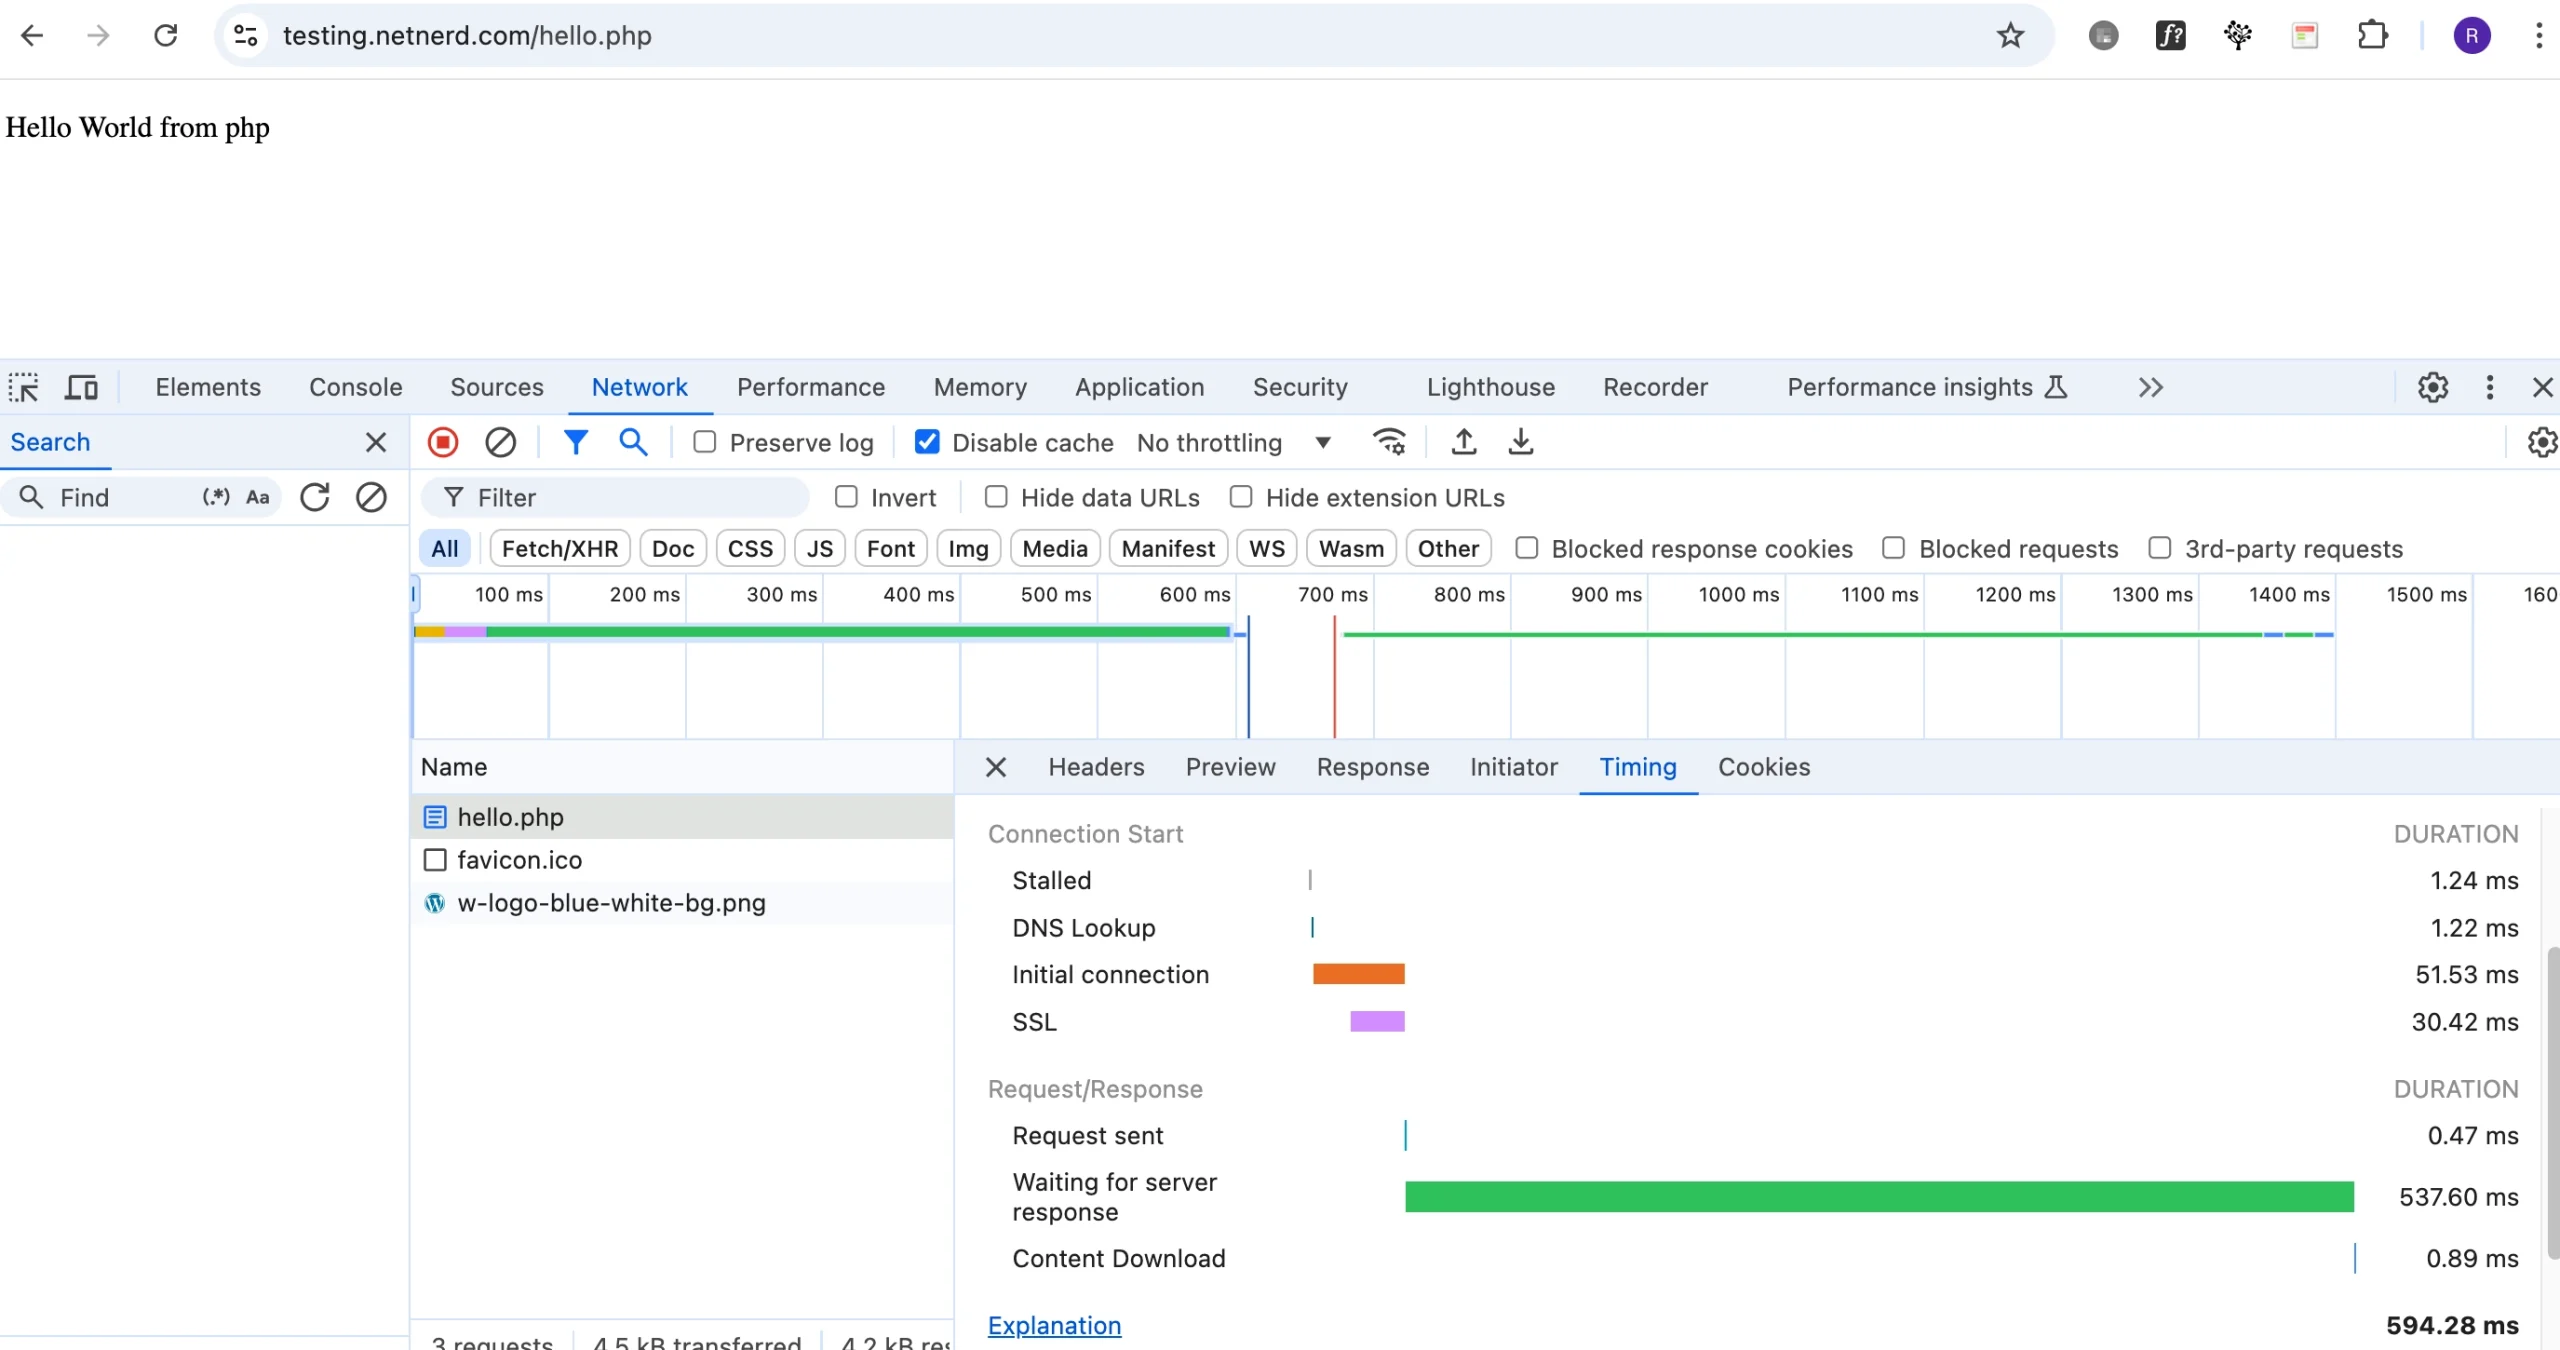
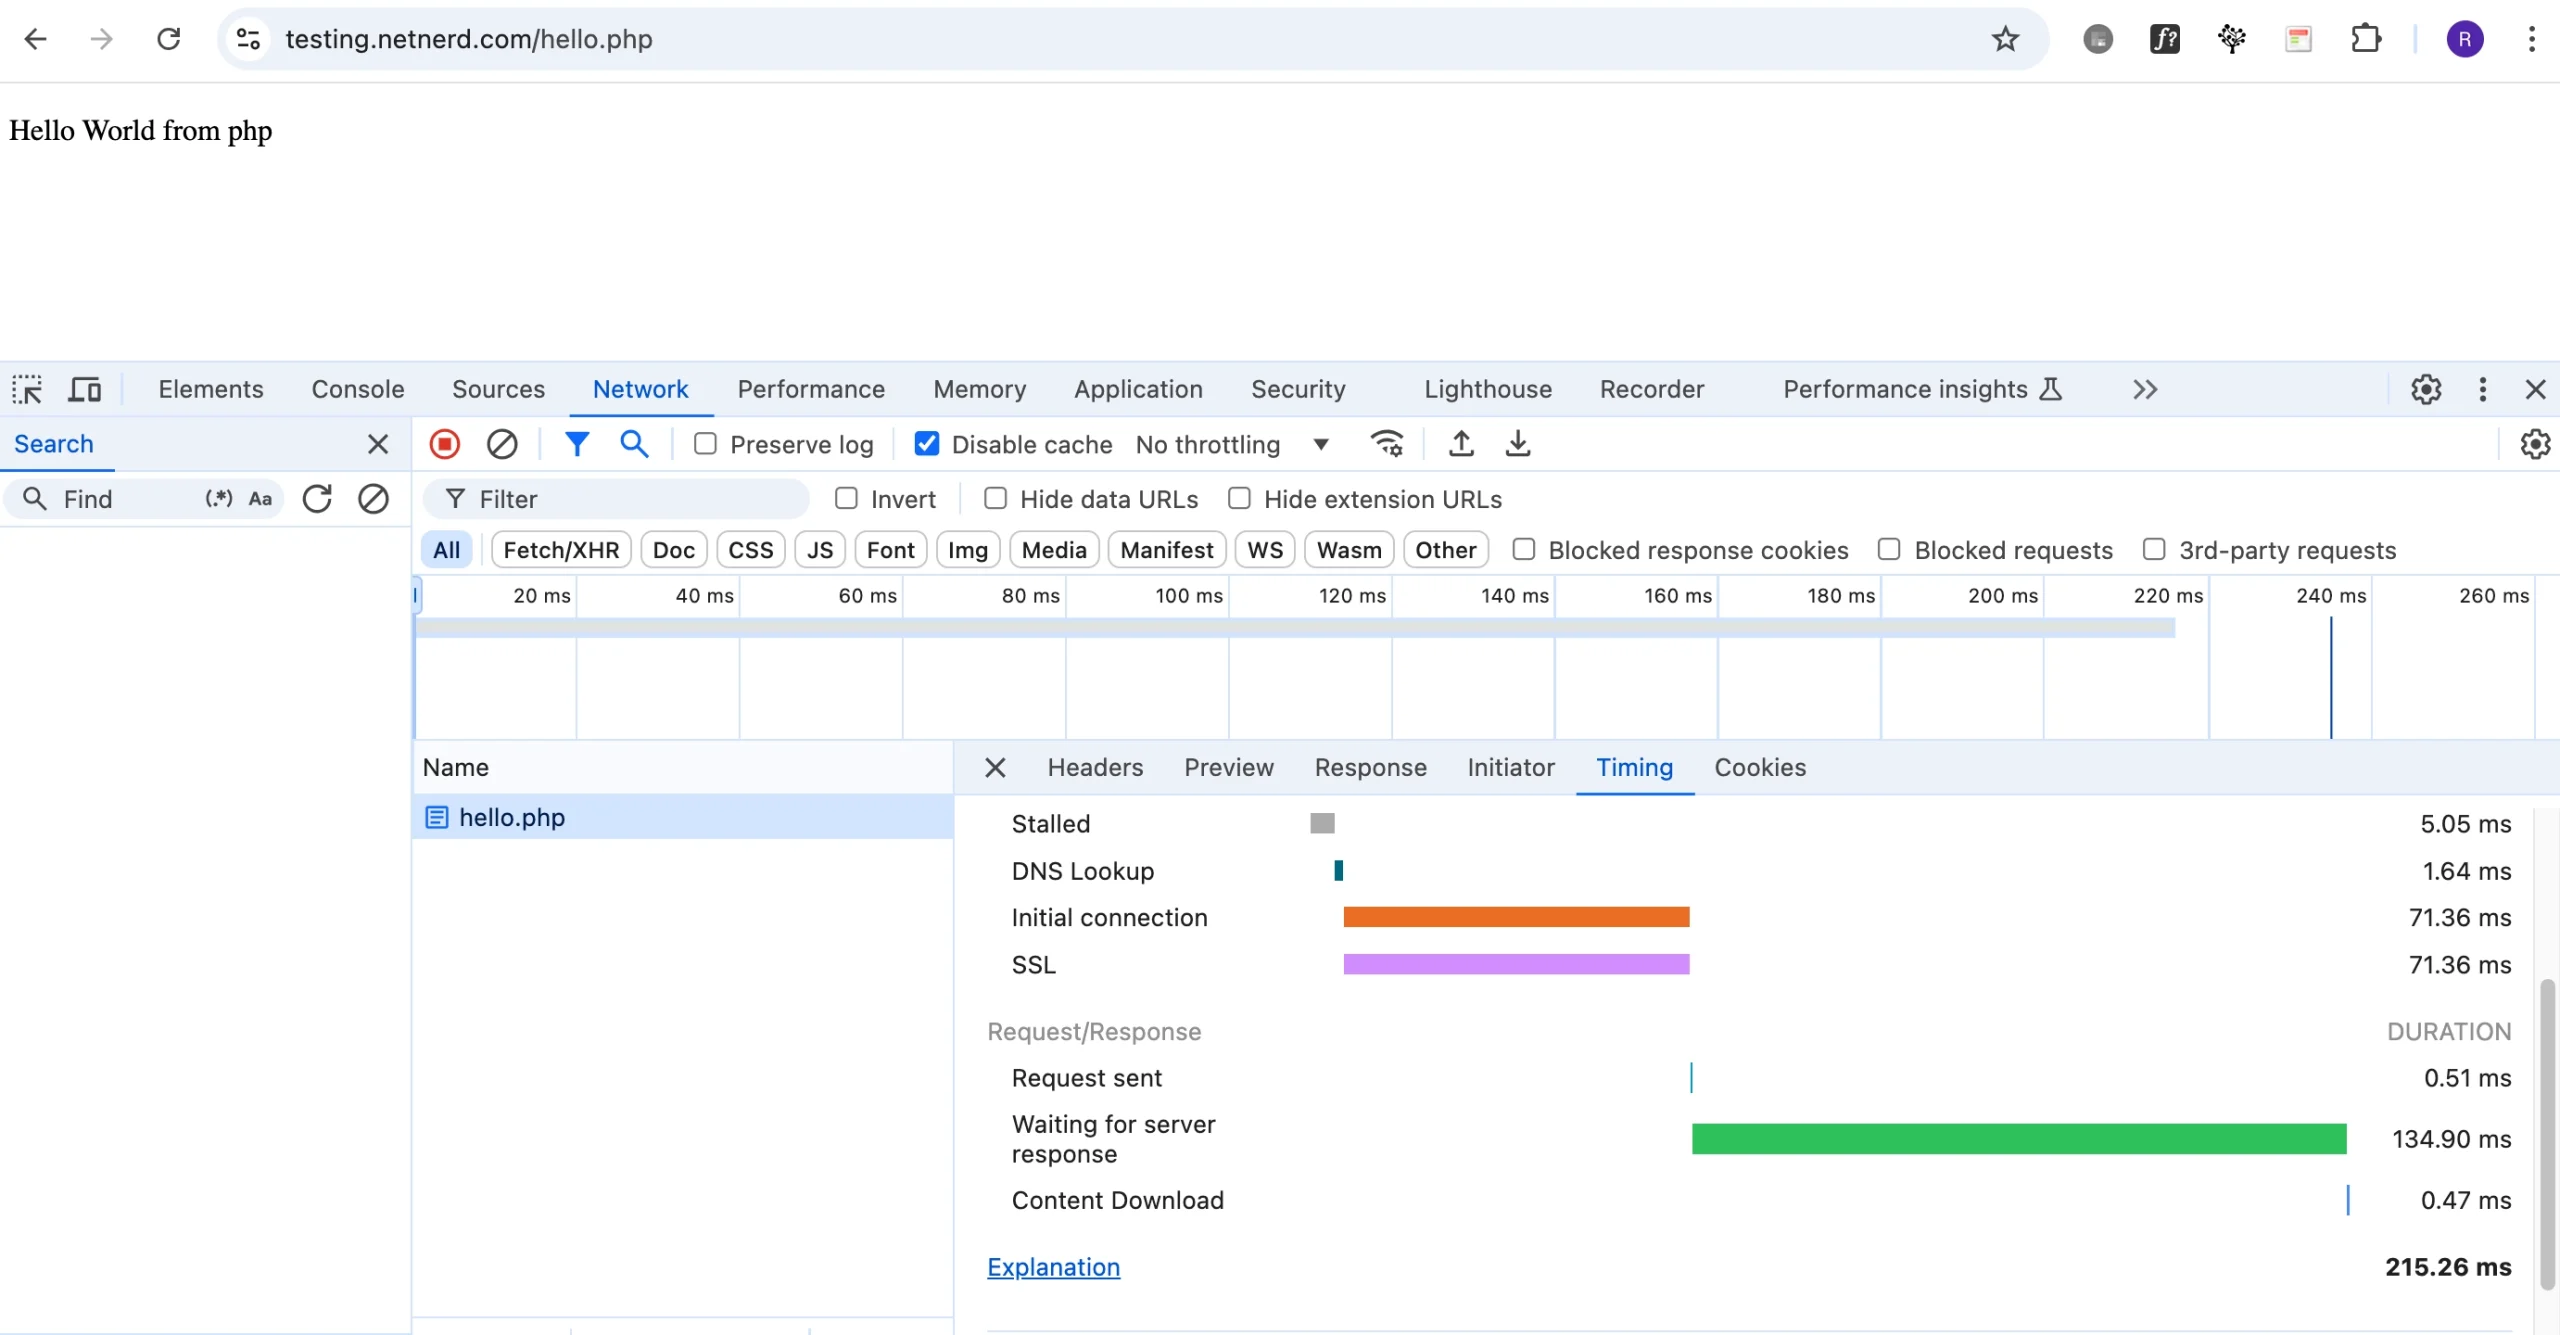
</html>A hello.php containing:
<!DOCTYPE html>
<html>
    <body>
        <?php echo '<p>Hello World from php</p>'; ?>
    </body>
</html>
And a WordPress website running on the domain alone ( https://testing.netnerd.com/ ).
I’m going to use the command in the cPanel article linked to above to test response times. This command times how long the command takes to run, when manually specifying where the domain resolves to (therefore eliminating the DNS lookup overhead).
After each run of each command, I’m going to kill the user processes that have opened as a result of the command being run. The reason I’m doing this is to simulate no re-use of existing PHP processes that opened as a consequence of the command being previously run. This gives a realistic “new” connection perspective. This might seem a cynical approach, but you don’t know if Google checking your site will take place when a pre-existing PHP process is open, or if it will take place when there are no pre-existing PHP processes open.
If I run cPanel’s test to hello.html 5 times I get an average of 0.0964 seconds.
netnerd@NetNerds-MacBook-Pro .ssh % time curl -o /dev/null -silent –resolve testing.netnerd.com:443:185.229.21.103 https://testing.netnerd.com:443/hello.html
curl -o /dev/null -silent –resolve testing.netnerd.com:443:185.229.21.103 0.01s user 0.01s system 23% cpu 0.103 total
netnerd@NetNerds-MacBook-Pro .ssh % time curl -o /dev/null -silent –resolve testing.netnerd.com:443:185.229.21.103 https://testing.netnerd.com:443/hello.html
curl -o /dev/null -silent –resolve testing.netnerd.com:443:185.229.21.103 0.01s user 0.01s system 21% cpu 0.093 total
netnerd@NetNerds-MacBook-Pro .ssh % time curl -o /dev/null -silent –resolve testing.netnerd.com:443:185.229.21.103 https://testing.netnerd.com:443/hello.html
curl -o /dev/null -silent –resolve testing.netnerd.com:443:185.229.21.103 0.01s user 0.01s system 22% cpu 0.093 total
netnerd@NetNerds-MacBook-Pro .ssh % time curl -o /dev/null -silent –resolve testing.netnerd.com:443:185.229.21.103 https://testing.netnerd.com:443/hello.html
curl -o /dev/null -silent –resolve testing.netnerd.com:443:185.229.21.103 0.01s user 0.01s system 22% cpu 0.099 total
netnerd@NetNerds-MacBook-Pro .ssh % time curl -o /dev/null -silent –resolve testing.netnerd.com:443:185.229.21.103 https://testing.netnerd.com:443/hello.html
curl -o /dev/null -silent –resolve testing.netnerd.com:443:185.229.21.103 0.01s user 0.01s system 23% cpu 0.094 total
for this block. You can use this space for describing your block.
If I run cPanel’s test to hello.php times I get an average of 0.7164 seconds.
netnerd@NetNerds-MacBook-Pro .ssh % time curl -o /dev/null -silent –resolve testing.netnerd.com:443:185.229.21.103 https://testing.netnerd.com:443/hello.php
curl -o /dev/null -silent –resolve testing.netnerd.com:443:185.229.21.103 0.01s user 0.01s system 3% cpu 0.636 total
netnerd@NetNerds-MacBook-Pro .ssh % time curl -o /dev/null -silent –resolve testing.netnerd.com:443:185.229.21.103 https://testing.netnerd.com:443/hello.php
curl -o /dev/null -silent –resolve testing.netnerd.com:443:185.229.21.103 0.01s user 0.01s system 3% cpu 0.695 total
netnerd@NetNerds-MacBook-Pro .ssh % time curl -o /dev/null -silent –resolve testing.netnerd.com:443:185.229.21.103 https://testing.netnerd.com:443/hello.php
curl -o /dev/null -silent –resolve testing.netnerd.com:443:185.229.21.103 0.01s user 0.01s system 3% cpu 0.747 total
netnerd@NetNerds-MacBook-Pro .ssh % time curl -o /dev/null -silent –resolve testing.netnerd.com:443:185.229.21.103 https://testing.netnerd.com:443/hello.php
curl -o /dev/null -silent –resolve testing.netnerd.com:443:185.229.21.103 0.01s user 0.01s system 3% cpu 0.645 total
netnerd@NetNerds-MacBook-Pro .ssh % time curl -o /dev/null -silent –resolve testing.netnerd.com:443:185.229.21.103 https://testing.netnerd.com:443/hello.php
curl -o /dev/null -silent –resolve testing.netnerd.com:443:185.229.21.103 0.01s user 0.01s system 2% cpu 0.859 total
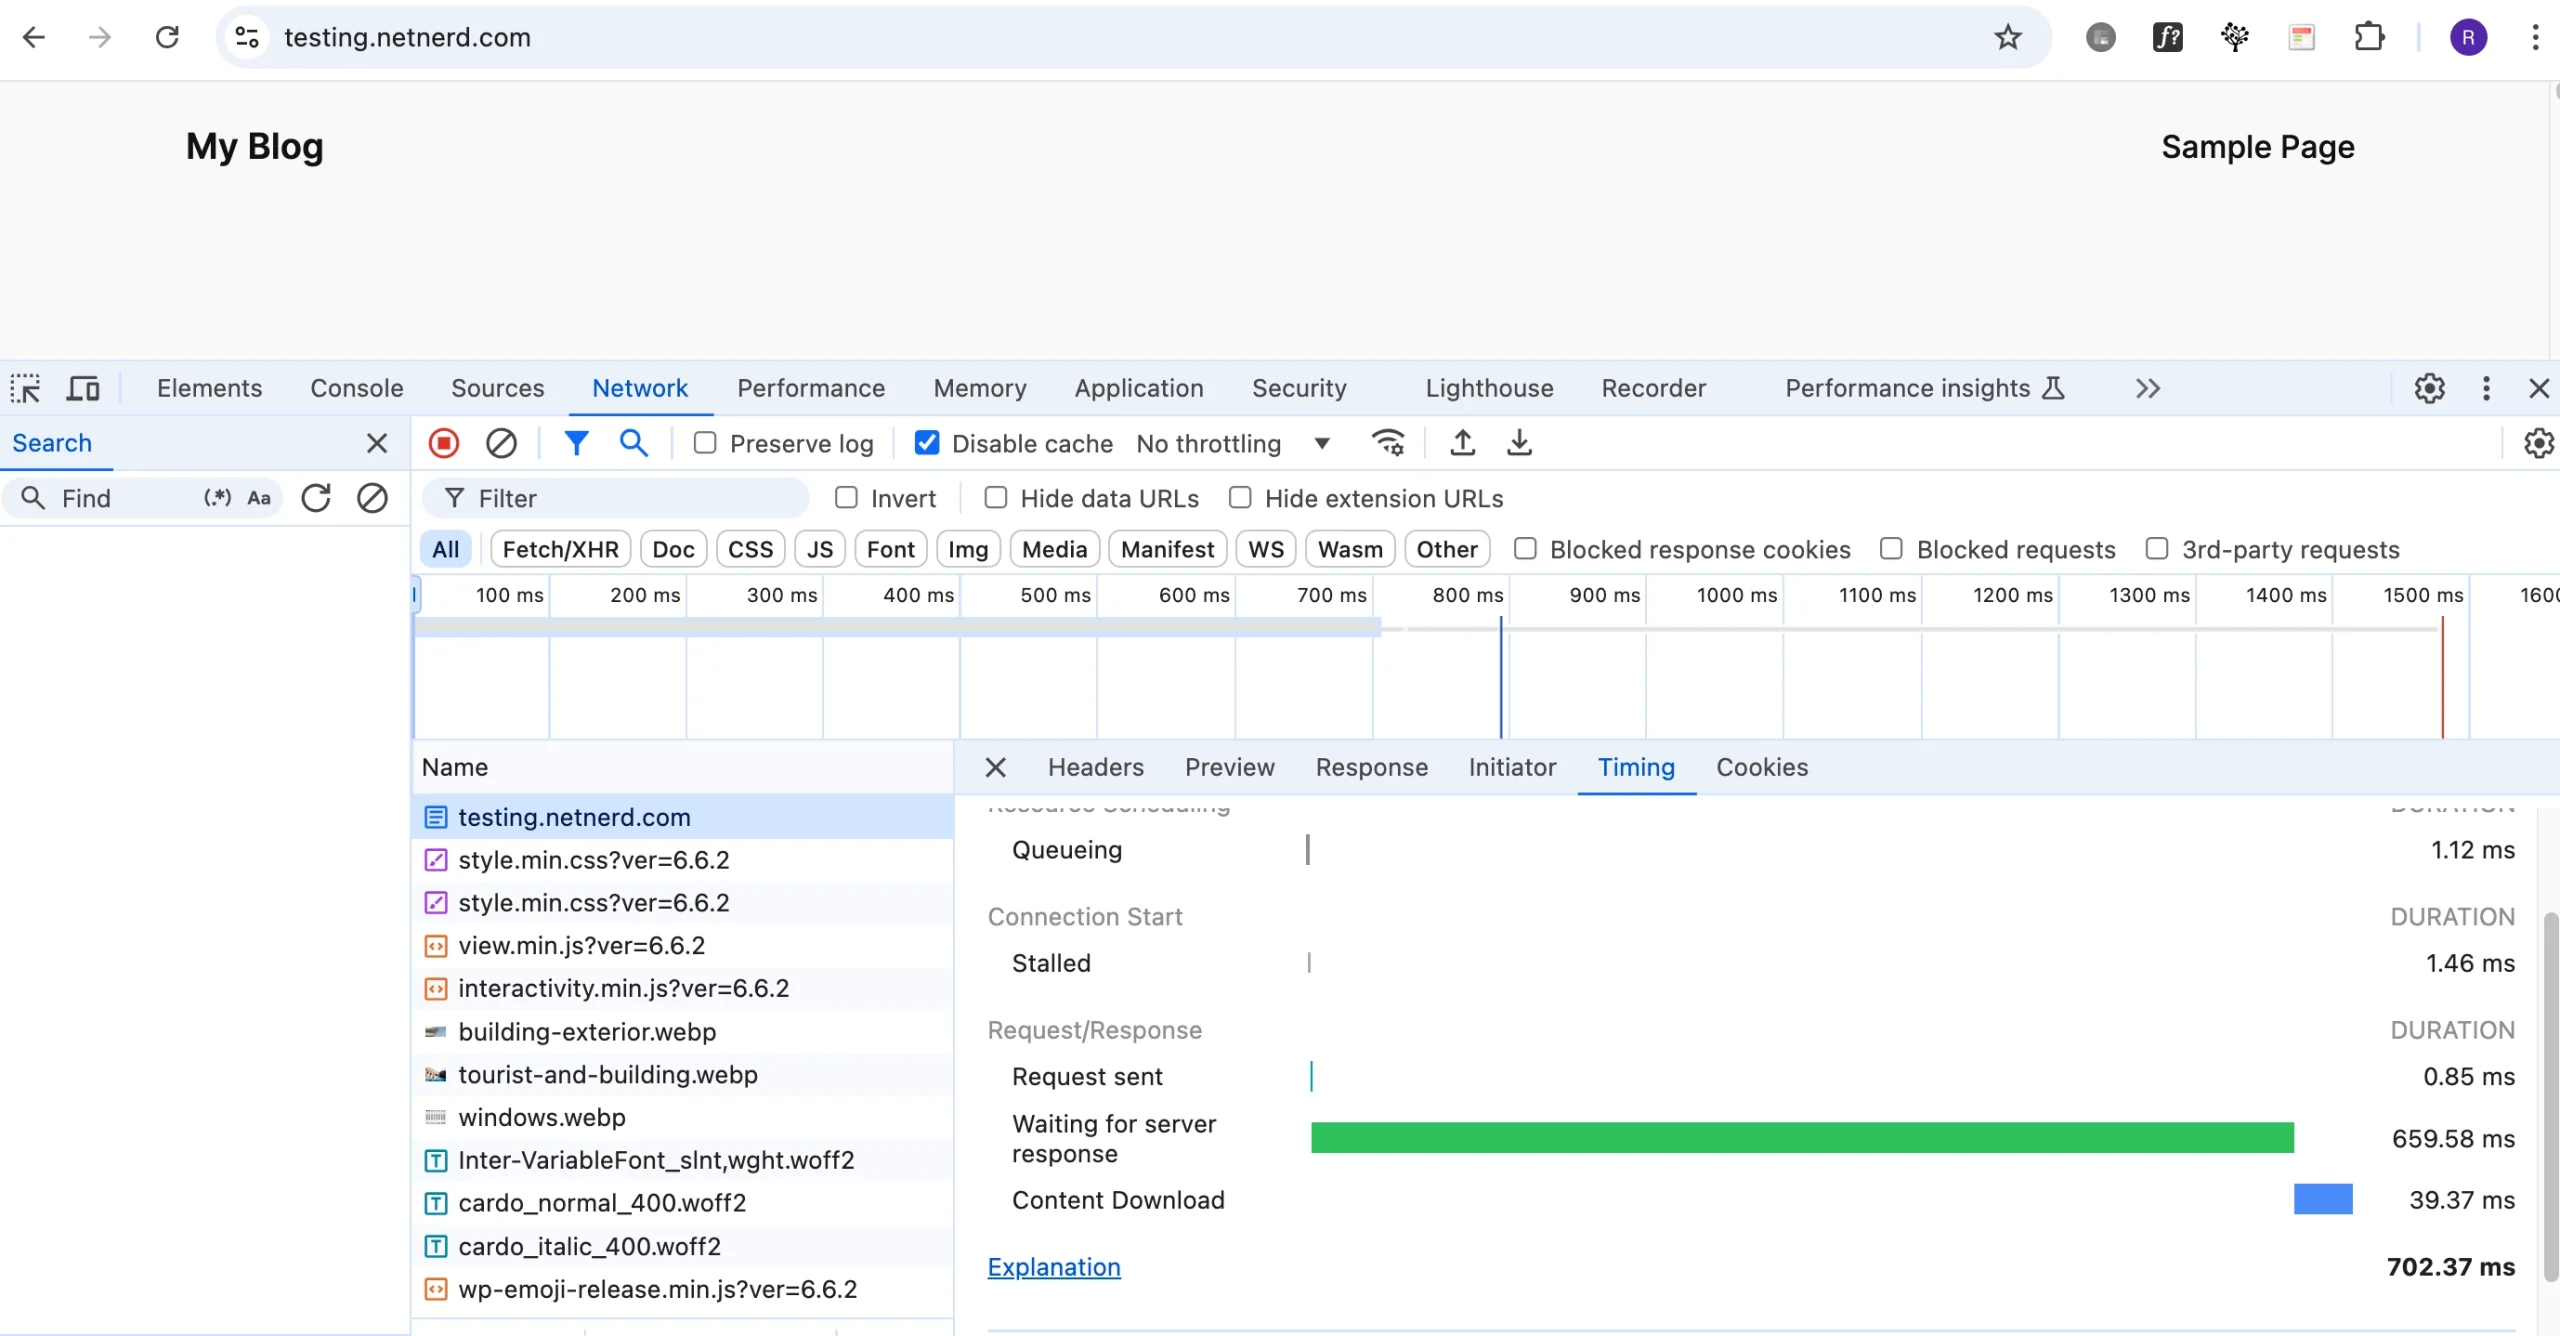
If I run cPanel’s test to WordPress I get an average of 1.4786 seconds.
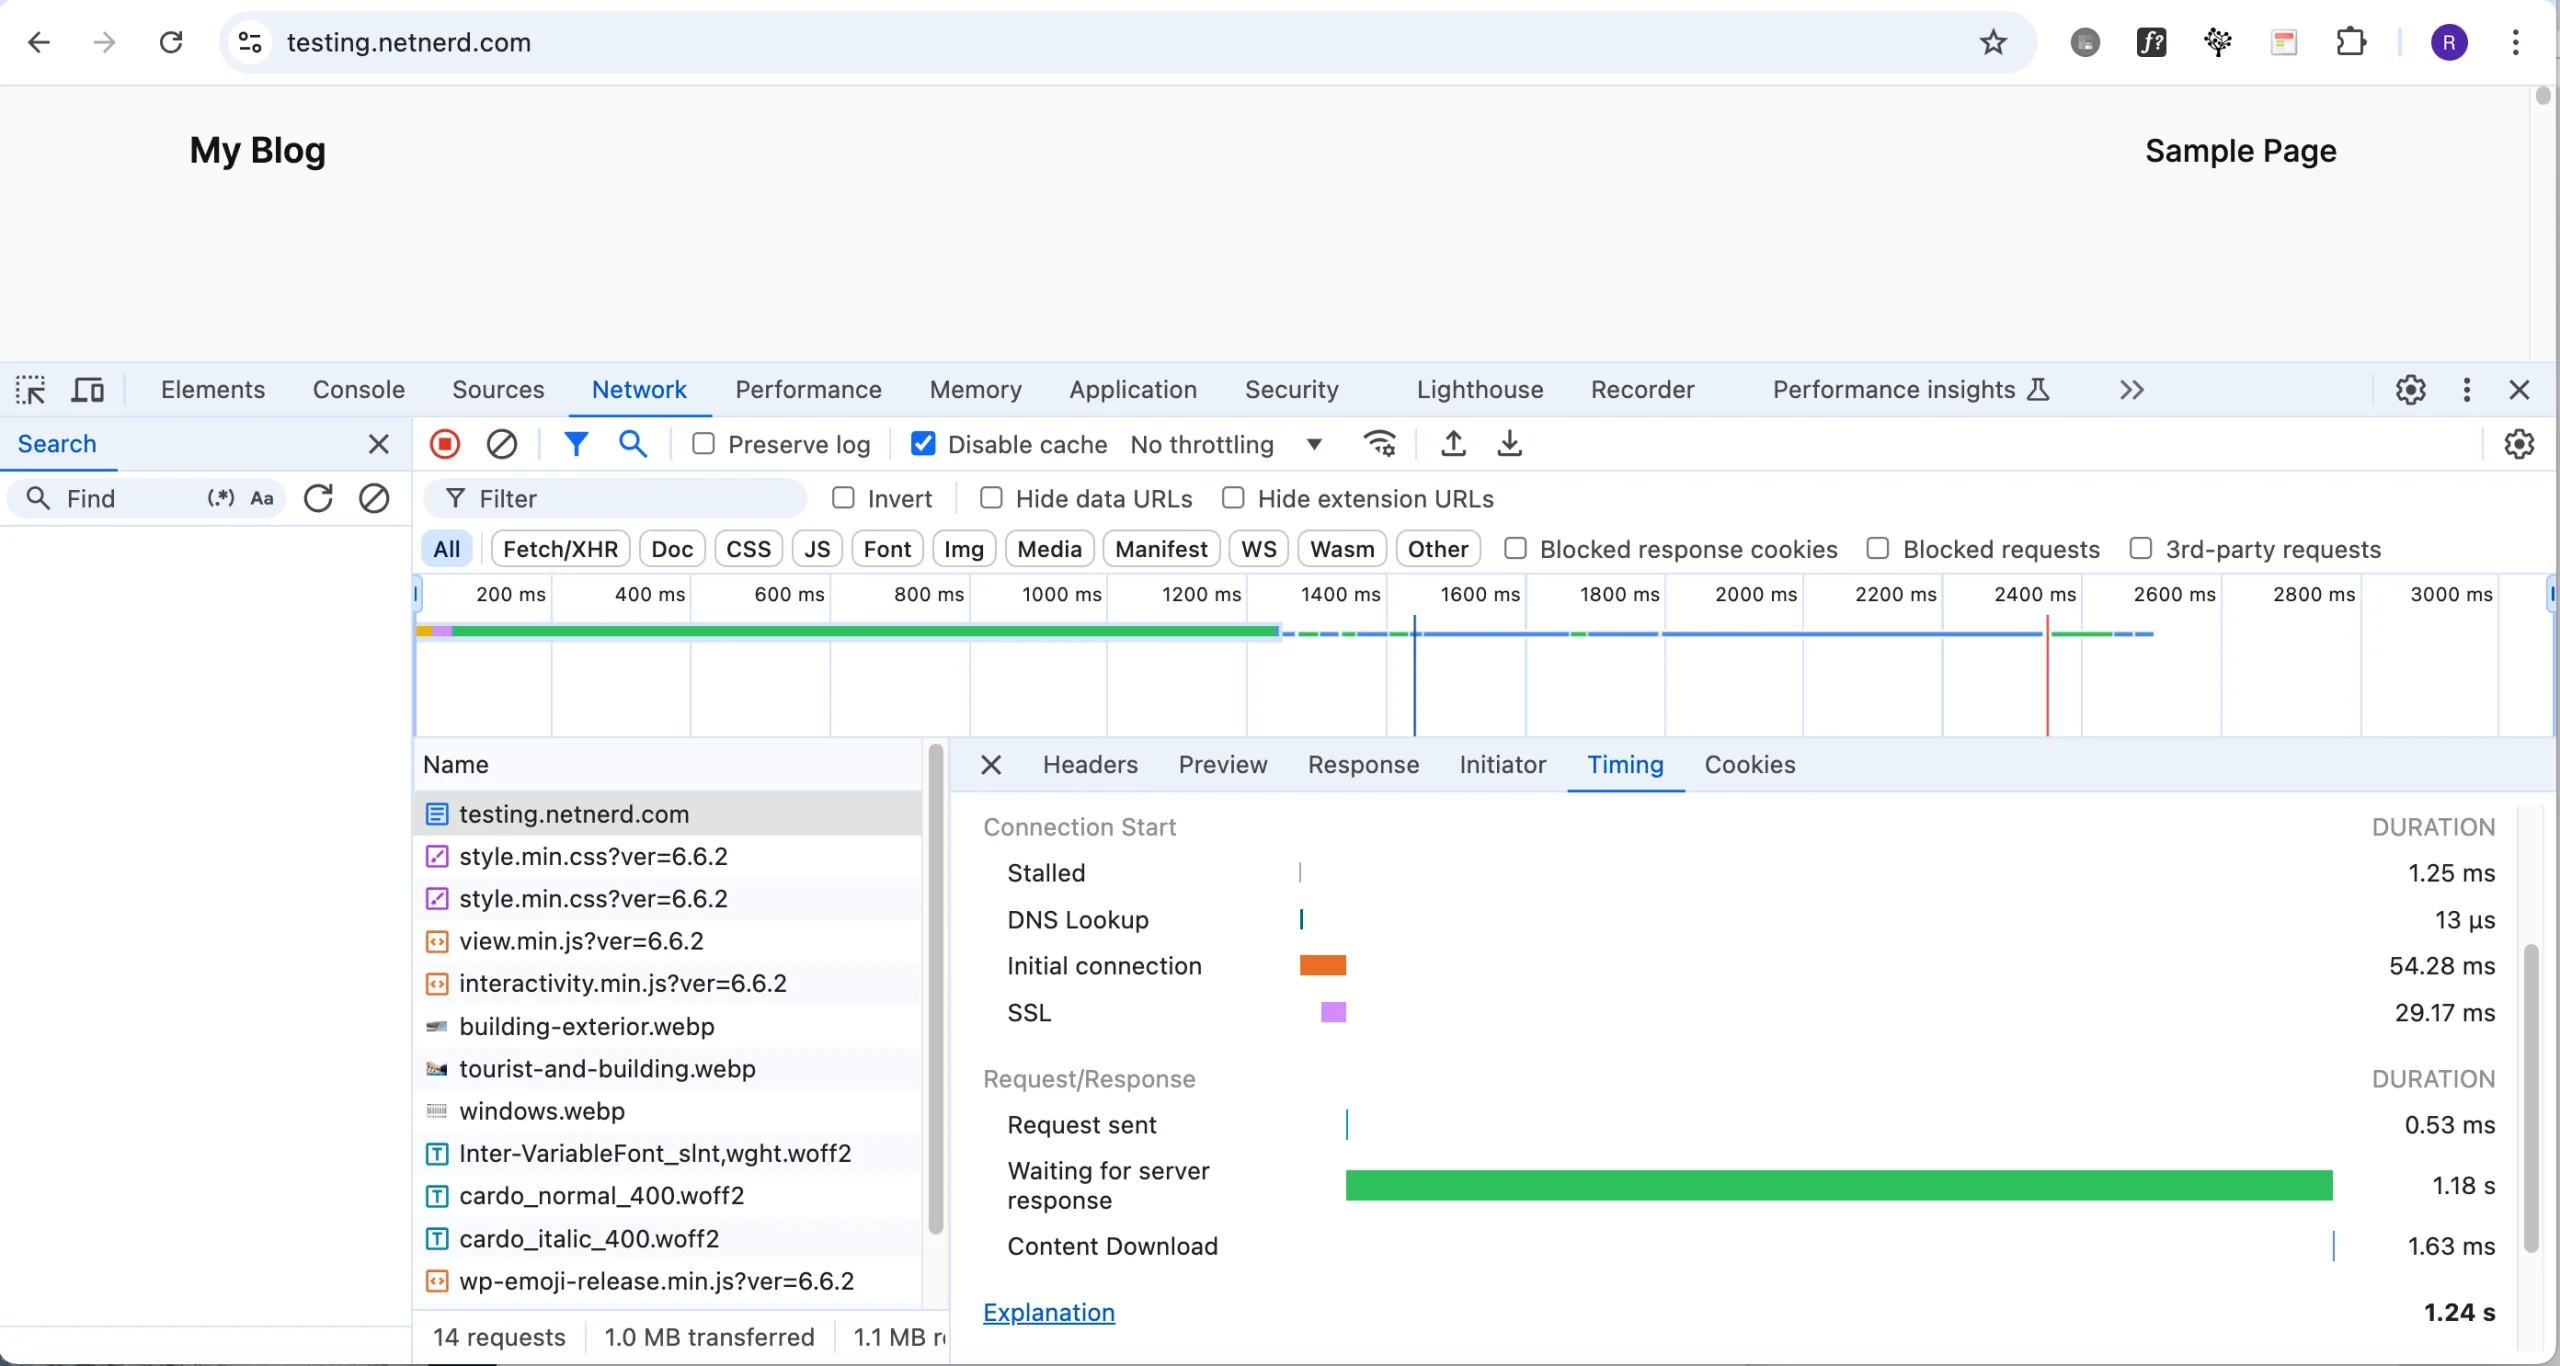
netnerd@NetNerds-MacBook-Pro .ssh % time curl -o /dev/null -silent –resolve testing.netnerd.com:443:185.229.21.103 https://testing.netnerd.com:443/
curl -o /dev/null -silent –resolve testing.netnerd.com:443:185.229.21.103 0.01s user 0.01s system 1% cpu 1.759 total
netnerd@NetNerds-MacBook-Pro .ssh % time curl -o /dev/null -silent –resolve testing.netnerd.com:443:185.229.21.103 https://testing.netnerd.com:443/
curl -o /dev/null -silent –resolve testing.netnerd.com:443:185.229.21.103 0.01s user 0.01s system 1% cpu 1.297 total
netnerd@NetNerds-MacBook-Pro .ssh % time curl -o /dev/null -silent –resolve testing.netnerd.com:443:185.229.21.103 https://testing.netnerd.com:443/
curl -o /dev/null -silent –resolve testing.netnerd.com:443:185.229.21.103 0.01s user 0.01s system 1% cpu 1.477 total
netnerd@NetNerds-MacBook-Pro .ssh % time curl -o /dev/null -silent –resolve testing.netnerd.com:443:185.229.21.103 https://testing.netnerd.com:443/
curl -o /dev/null -silent –resolve testing.netnerd.com:443:185.229.21.103 0.01s user 0.01s system 1% cpu 1.340 total
netnerd@NetNerds-MacBook-Pro .ssh % time curl -o /dev/null -silent –resolve testing.netnerd.com:443:185.229.21.103 https://testing.netnerd.com:443/
curl -o /dev/null -silent –resolve testing.netnerd.com:443:185.229.21.103 0.01s user 0.01s system 1% cpu 1.520 total
As you can see, there is a difference between the hello.html test and the hello.php test of 0.62 seconds. This isn’t as great as the difference between WordPress and hello.html (1.3822 seconds), but nonetheless there is a difference. The difference between hello.php and hello.html is the use of PHP itself. You’ve got an additional 0.62 seconds on the server response time, just by using PHP.
You might think that 0.62 isn’t that much, but when you consider that a good LCP is under 2.5 seconds, is potentially just under 1/4 of this. If you consider that a good TTFB is 800ms, then 0.62 seconds (or 620ms) is about 3/4 of this.
When you look at the additional time overhead involved just be using PHP, that’s proportionately quite a large amount in the context of LCP and TTFP times.
Now I’m going to convert the server (yes, the same server) to use the Litespeed web server (which replaces apache) and run the same tests. This is the only change made when testing.
If I run cPanel’s test to hello.html 5 times I get an average of 0.0938 seconds (difference from apache -0.0026 seconds).
netnerd@NetNerds-MacBook-Pro .ssh % time curl -o /dev/null -silent –resolve testing.netnerd.com:443:185.229.21.103 https://testing.netnerd.com:443/hello.html
curl -o /dev/null -silent –resolve testing.netnerd.com:443:185.229.21.103 0.01s user 0.01s system 23% cpu 0.096 total
netnerd@NetNerds-MacBook-Pro .ssh % time curl -o /dev/null -silent –resolve testing.netnerd.com:443:185.229.21.103 https://testing.netnerd.com:443/hello.html
curl -o /dev/null -silent –resolve testing.netnerd.com:443:185.229.21.103 0.01s user 0.01s system 22% cpu 0.096 total
netnerd@NetNerds-MacBook-Pro .ssh % time curl -o /dev/null -silent –resolve testing.netnerd.com:443:185.229.21.103 https://testing.netnerd.com:443/hello.html
curl -o /dev/null -silent –resolve testing.netnerd.com:443:185.229.21.103 0.01s user 0.01s system 24% cpu 0.095 total
netnerd@NetNerds-MacBook-Pro .ssh % time curl -o /dev/null -silent –resolve testing.netnerd.com:443:185.229.21.103 https://testing.netnerd.com:443/hello.html
curl -o /dev/null -silent –resolve testing.netnerd.com:443:185.229.21.103 0.01s user 0.01s system 26% cpu 0.090 total
netnerd@NetNerds-MacBook-Pro .ssh % time curl -o /dev/null -silent –resolve testing.netnerd.com:443:185.229.21.103 https://testing.netnerd.com:443/hello.html
curl -o /dev/null -silent –resolve testing.netnerd.com:443:185.229.21.103 0.01s user 0.01s system 25% cpu 0.092 total
If I run cPanel’s test to hello.php times I get an average of 0.1696 seconds (difference from apache -0.5468 seconds).
netnerd@NetNerds-MacBook-Pro .ssh % time curl -o /dev/null -silent –resolve testing.netnerd.com:443:185.229.21.103 https://testing.netnerd.com:443/hello.php
curl -o /dev/null -silent –resolve testing.netnerd.com:443:185.229.21.103 0.01s user 0.01s system 12% cpu 0.177 total
netnerd@NetNerds-MacBook-Pro .ssh % time curl -o /dev/null -silent –resolve testing.netnerd.com:443:185.229.21.103 https://testing.netnerd.com:443/hello.php
curl -o /dev/null -silent –resolve testing.netnerd.com:443:185.229.21.103 0.01s user 0.01s system 12% cpu 0.172 total
netnerd@NetNerds-MacBook-Pro .ssh % time curl -o /dev/null -silent –resolve testing.netnerd.com:443:185.229.21.103 https://testing.netnerd.com:443/hello.php
curl -o /dev/null -silent –resolve testing.netnerd.com:443:185.229.21.103 0.01s user 0.01s system 13% cpu 0.166 total
netnerd@NetNerds-MacBook-Pro .ssh % time curl -o /dev/null -silent –resolve testing.netnerd.com:443:185.229.21.103 https://testing.netnerd.com:443/hello.php
curl -o /dev/null -silent –resolve testing.netnerd.com:443:185.229.21.103 0.01s user 0.01s system 14% cpu 0.164 total
netnerd@NetNerds-MacBook-Pro .ssh % time curl -o /dev/null -silent –resolve testing.netnerd.com:443:185.229.21.103 https://testing.netnerd.com:443/hello.php
curl -o /dev/null -silent –resolve testing.netnerd.com:443:185.229.21.103 0.01s user 0.01s system 13% cpu 0.169 total
If I run cPanel’s test to WordPress I get an average of 0.8912 seconds (difference from apache -0.5874 seconds).
netnerd@NetNerds-MacBook-Pro .ssh % time curl -o /dev/null -silent –resolve testing.netnerd.com:443:185.229.21.103 https://testing.netnerd.com:443/
curl -o /dev/null -silent –resolve testing.netnerd.com:443:185.229.21.103 0.01s user 0.01s system 2% cpu 0.811 total
netnerd@NetNerds-MacBook-Pro .ssh % time curl -o /dev/null -silent –resolve testing.netnerd.com:443:185.229.21.103 https://testing.netnerd.com:443/
curl -o /dev/null -silent –resolve testing.netnerd.com:443:185.229.21.103 0.01s user 0.01s system 2% cpu 0.944 total
netnerd@NetNerds-MacBook-Pro .ssh % time curl -o /dev/null -silent –resolve testing.netnerd.com:443:185.229.21.103 https://testing.netnerd.com:443/
curl -o /dev/null -silent –resolve testing.netnerd.com:443:185.229.21.103 0.01s user 0.01s system 2% cpu 0.902 total
netnerd@NetNerds-MacBook-Pro .ssh % time curl -o /dev/null -silent –resolve testing.netnerd.com:443:185.229.21.103 https://testing.netnerd.com:443/
curl -o /dev/null -silent –resolve testing.netnerd.com:443:185.229.21.103 0.01s user 0.01s system 2% cpu 0.964 total
netnerd@NetNerds-MacBook-Pro .ssh % time curl -o /dev/null -silent –resolve testing.netnerd.com:443:185.229.21.103 https://testing.netnerd.com:443/
curl -o /dev/null -silent –resolve testing.netnerd.com:443:185.229.21.103 0.01s user 0.01s system 2% cpu 0.835 total
As you can see from the results, just by using Litespeed instead of apache, the server response time reduces by around half a second.
Again, whilst this doesn’t sound like a great deal, half a second is 20% of 2.5 seconds (LCP), and 62.5% of 800ms (TTFB).
What this all equates to in practical terms is that if you use Litespeed web server based hosting, you’re going to reduce server response times, and therefore stand a much better chance of passing Core Web Vitals.
If you use Apache based hosting you will find it harder to pass Core Web Vitals, simply because the server takes longer to respond. This additional response time affects time based core web vitals metrics such as TTFB, FCP and LCP.
As we now know, Litespeed is faster, but what is it that causes this improvement in response times? The improvement seen in the testing above, is a product of Litespeed spawning PHP processes faster than apache.
Litespeed can also be used to bring HTTP/3 in to effect. HTTP/3 makes the encryption handshake (part of TTFB) faster. HTTP/3 also uses UDP instead of TCP/IP. With TCP/IP not all the network traffic is your data being transferred. Some network bandwidth is used by acknowledgement packets and resending of packets. Although TCP/IP is more reliable, it’s a bit slower because of this reliability. Although UDP isn’t as reliable, it is faster.
Why We Started Offering Litespeed Hosting
We started offering Litespeed web hosting by default at netnerd.com to provide our customers with the improvements in load times. This in turn helps our customers pass Core Web Vitals.
Despite an improvement in performance, we don’t charge any more for Litespeed based hosting, we build it in by default for all new shared hosting packages. This means that you can gain the advantages of litespeed based web hosting for as little as £4.99 per month with our Unlimited hosting package. You can also get Litespeed based hosting free for a year with the purchase of a domain, when using our Essentials hosting as part of this offer that we’re currently running.
You can gain the benefits of Litespeed based web hosting, and improve your core web vitals, simply by hosting with netnerd.com, and all at a reasonable price.
Another way you might think of this is:
Get ~20% Off Your Site’s Core Web Vitals When Hosting with Netnerd.com!
As I’ve set all this up and done all this testing, this wouldn’t be a complete story if I didn’t carry out one last set of tests. What I’m going to do now, is install the Litespeed cache plugin in the WordPress installation, implement a basic configuration, and see how it affect the TTFB test for WordPress.
Although this is something that WordPress users will have to undertake in their WordPress’ admin area, it’s not that difficult.
Installing and Configuring the Litespeed Cache Plugin.
You’d install and activate the the Litespeed cache plugin just like you would any other plugin.
After activating, and installing the Litespeed cache plugin, I’m going to access it’s preset configurations:
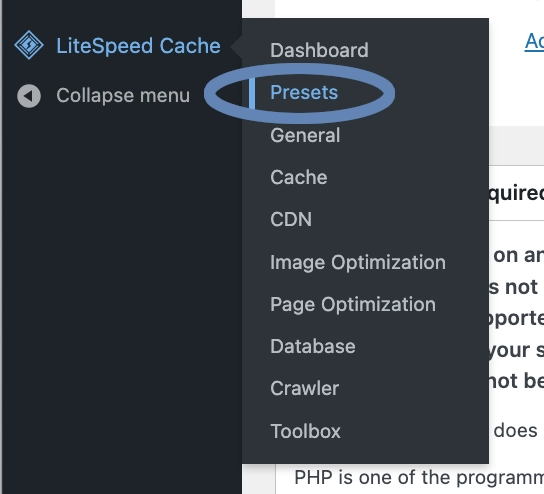
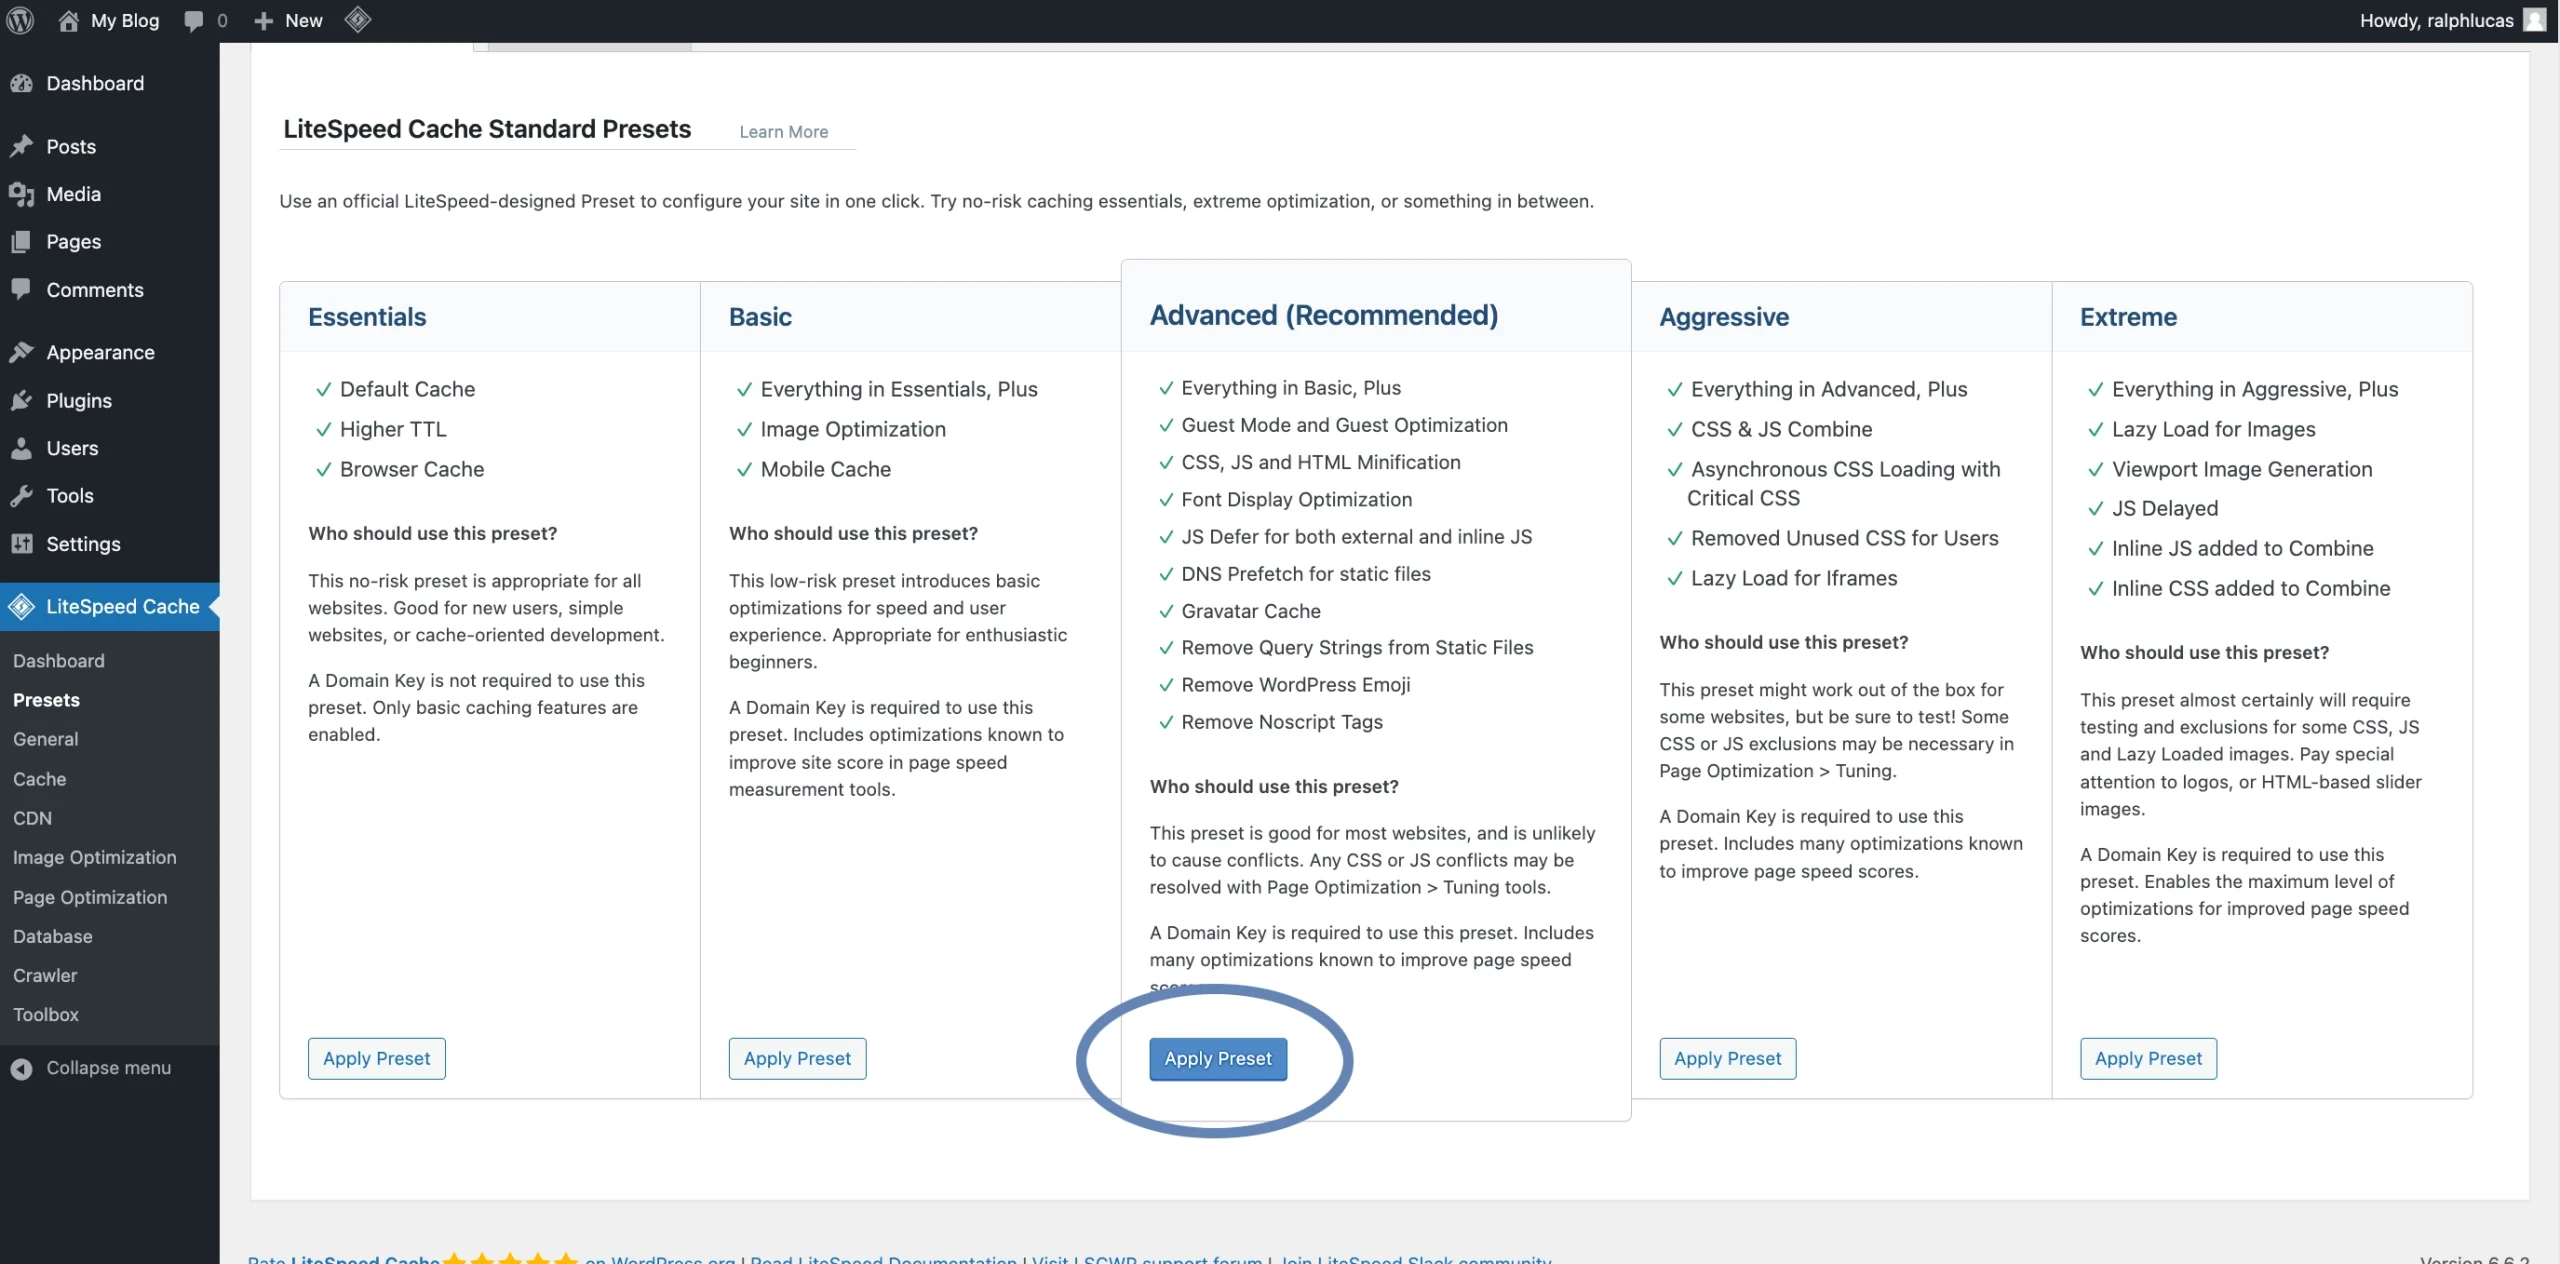
And simply apply the recommended preset:
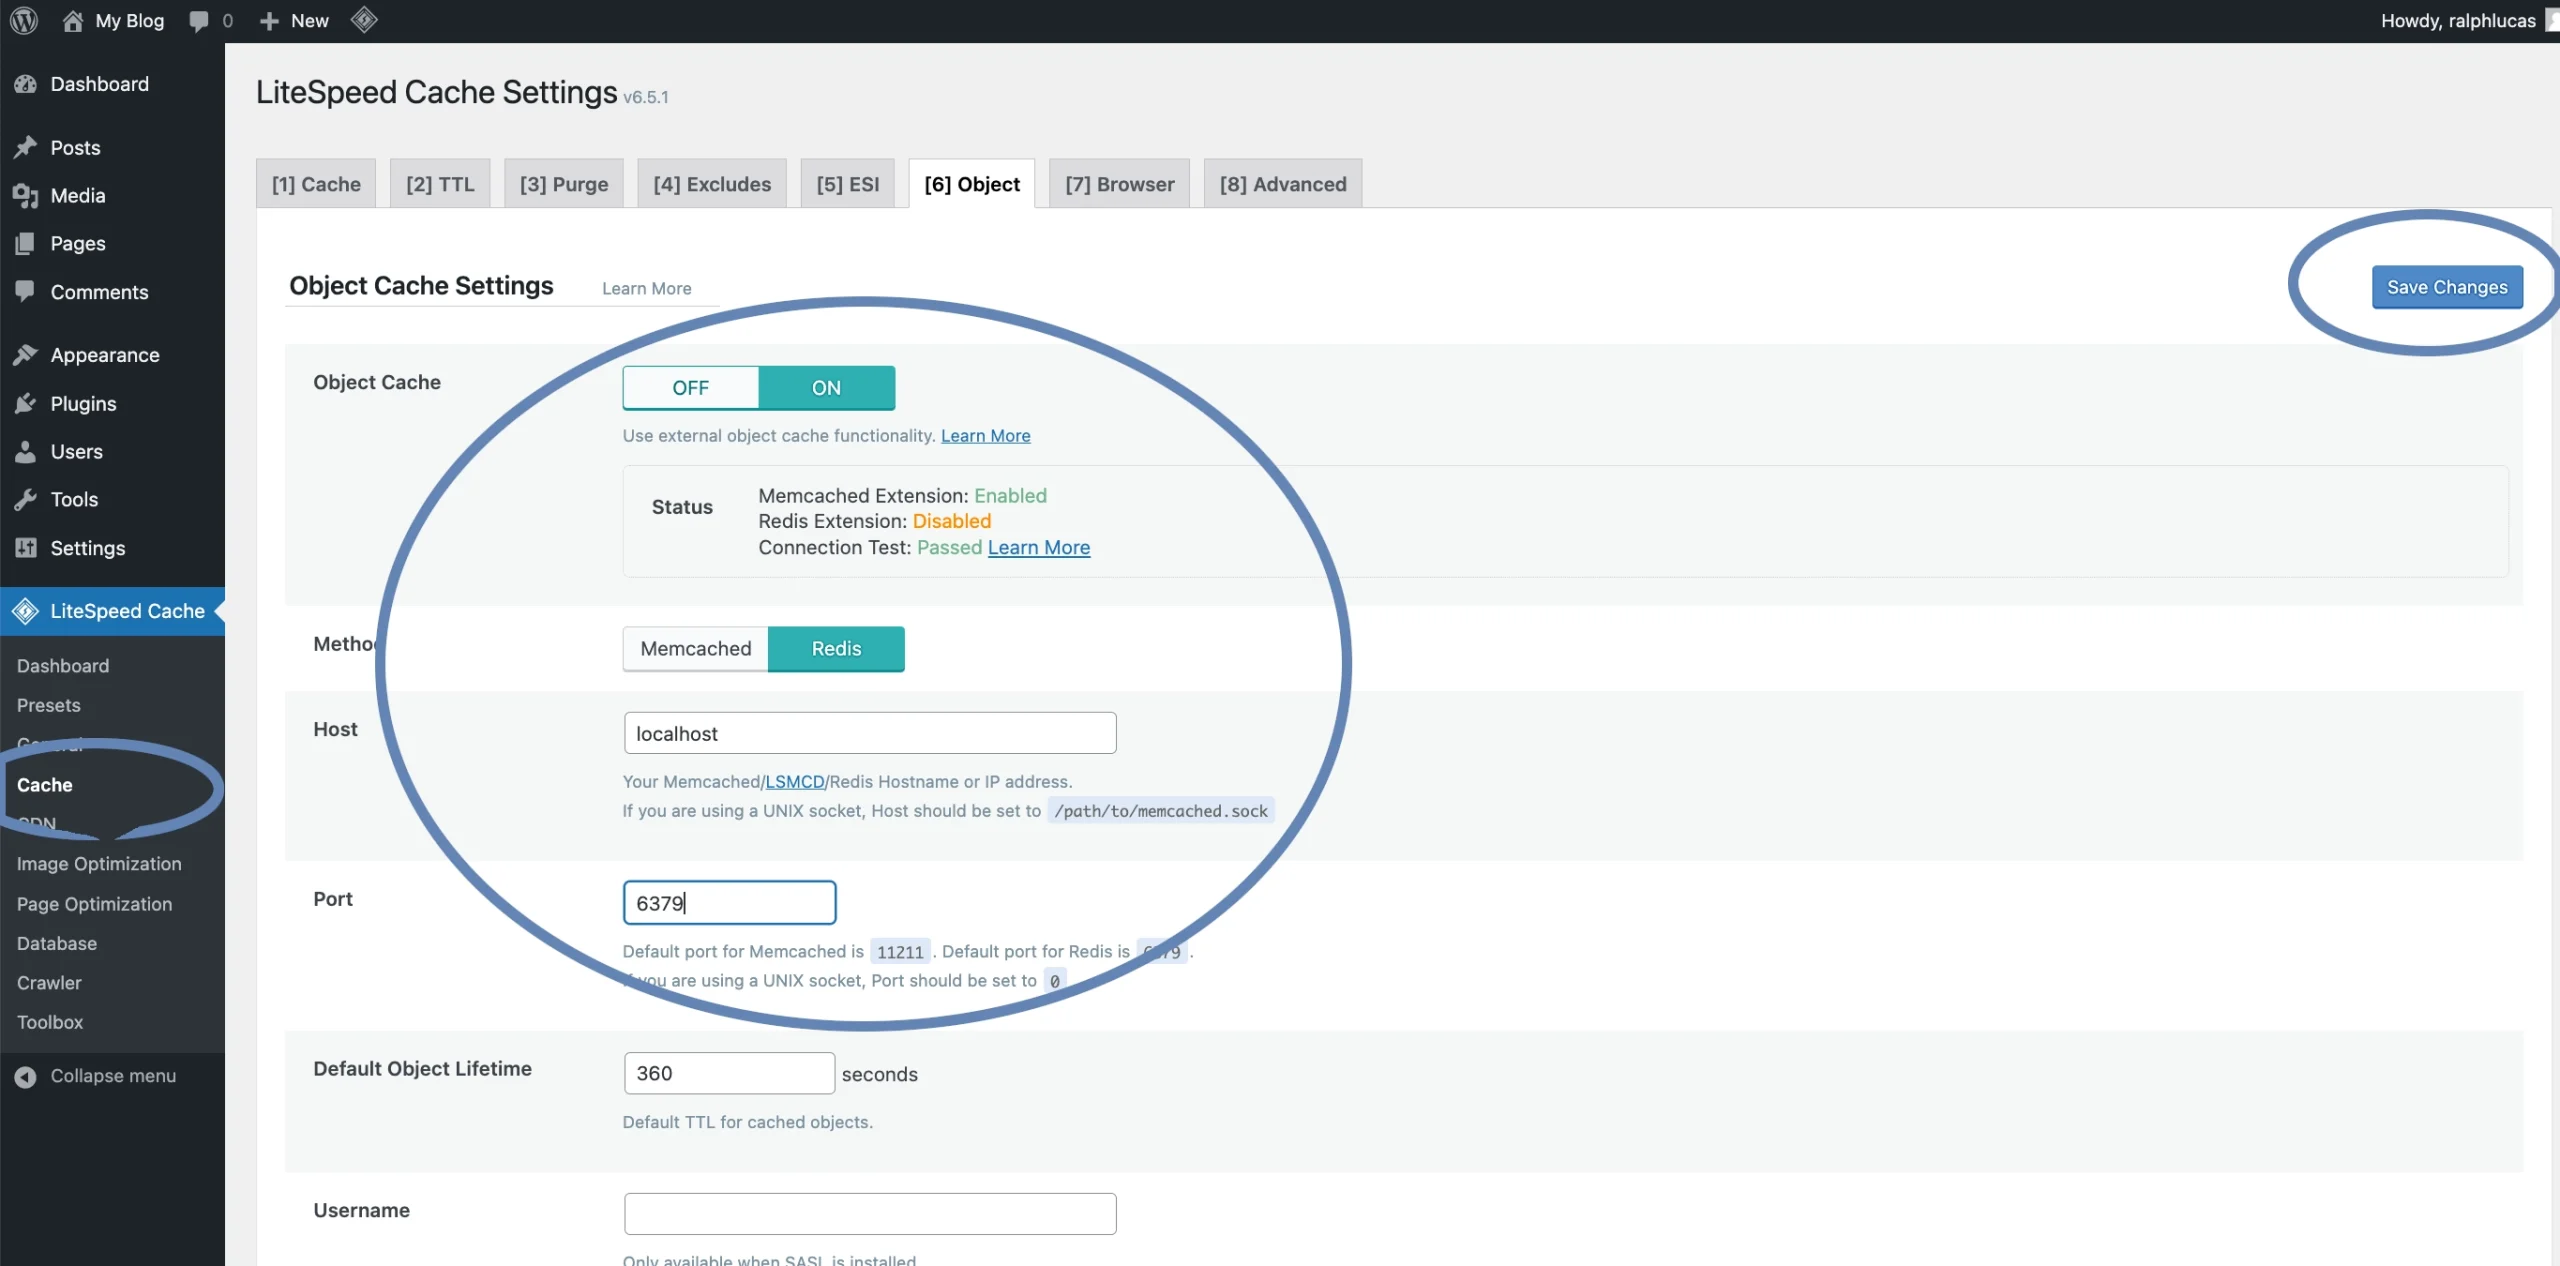
I’m then going to enable object caching, and I’d do this by clicking on “cache” on the left hand side, specifying the settings for redis (as per the screen shot below), and then clicking “Save Changes”:
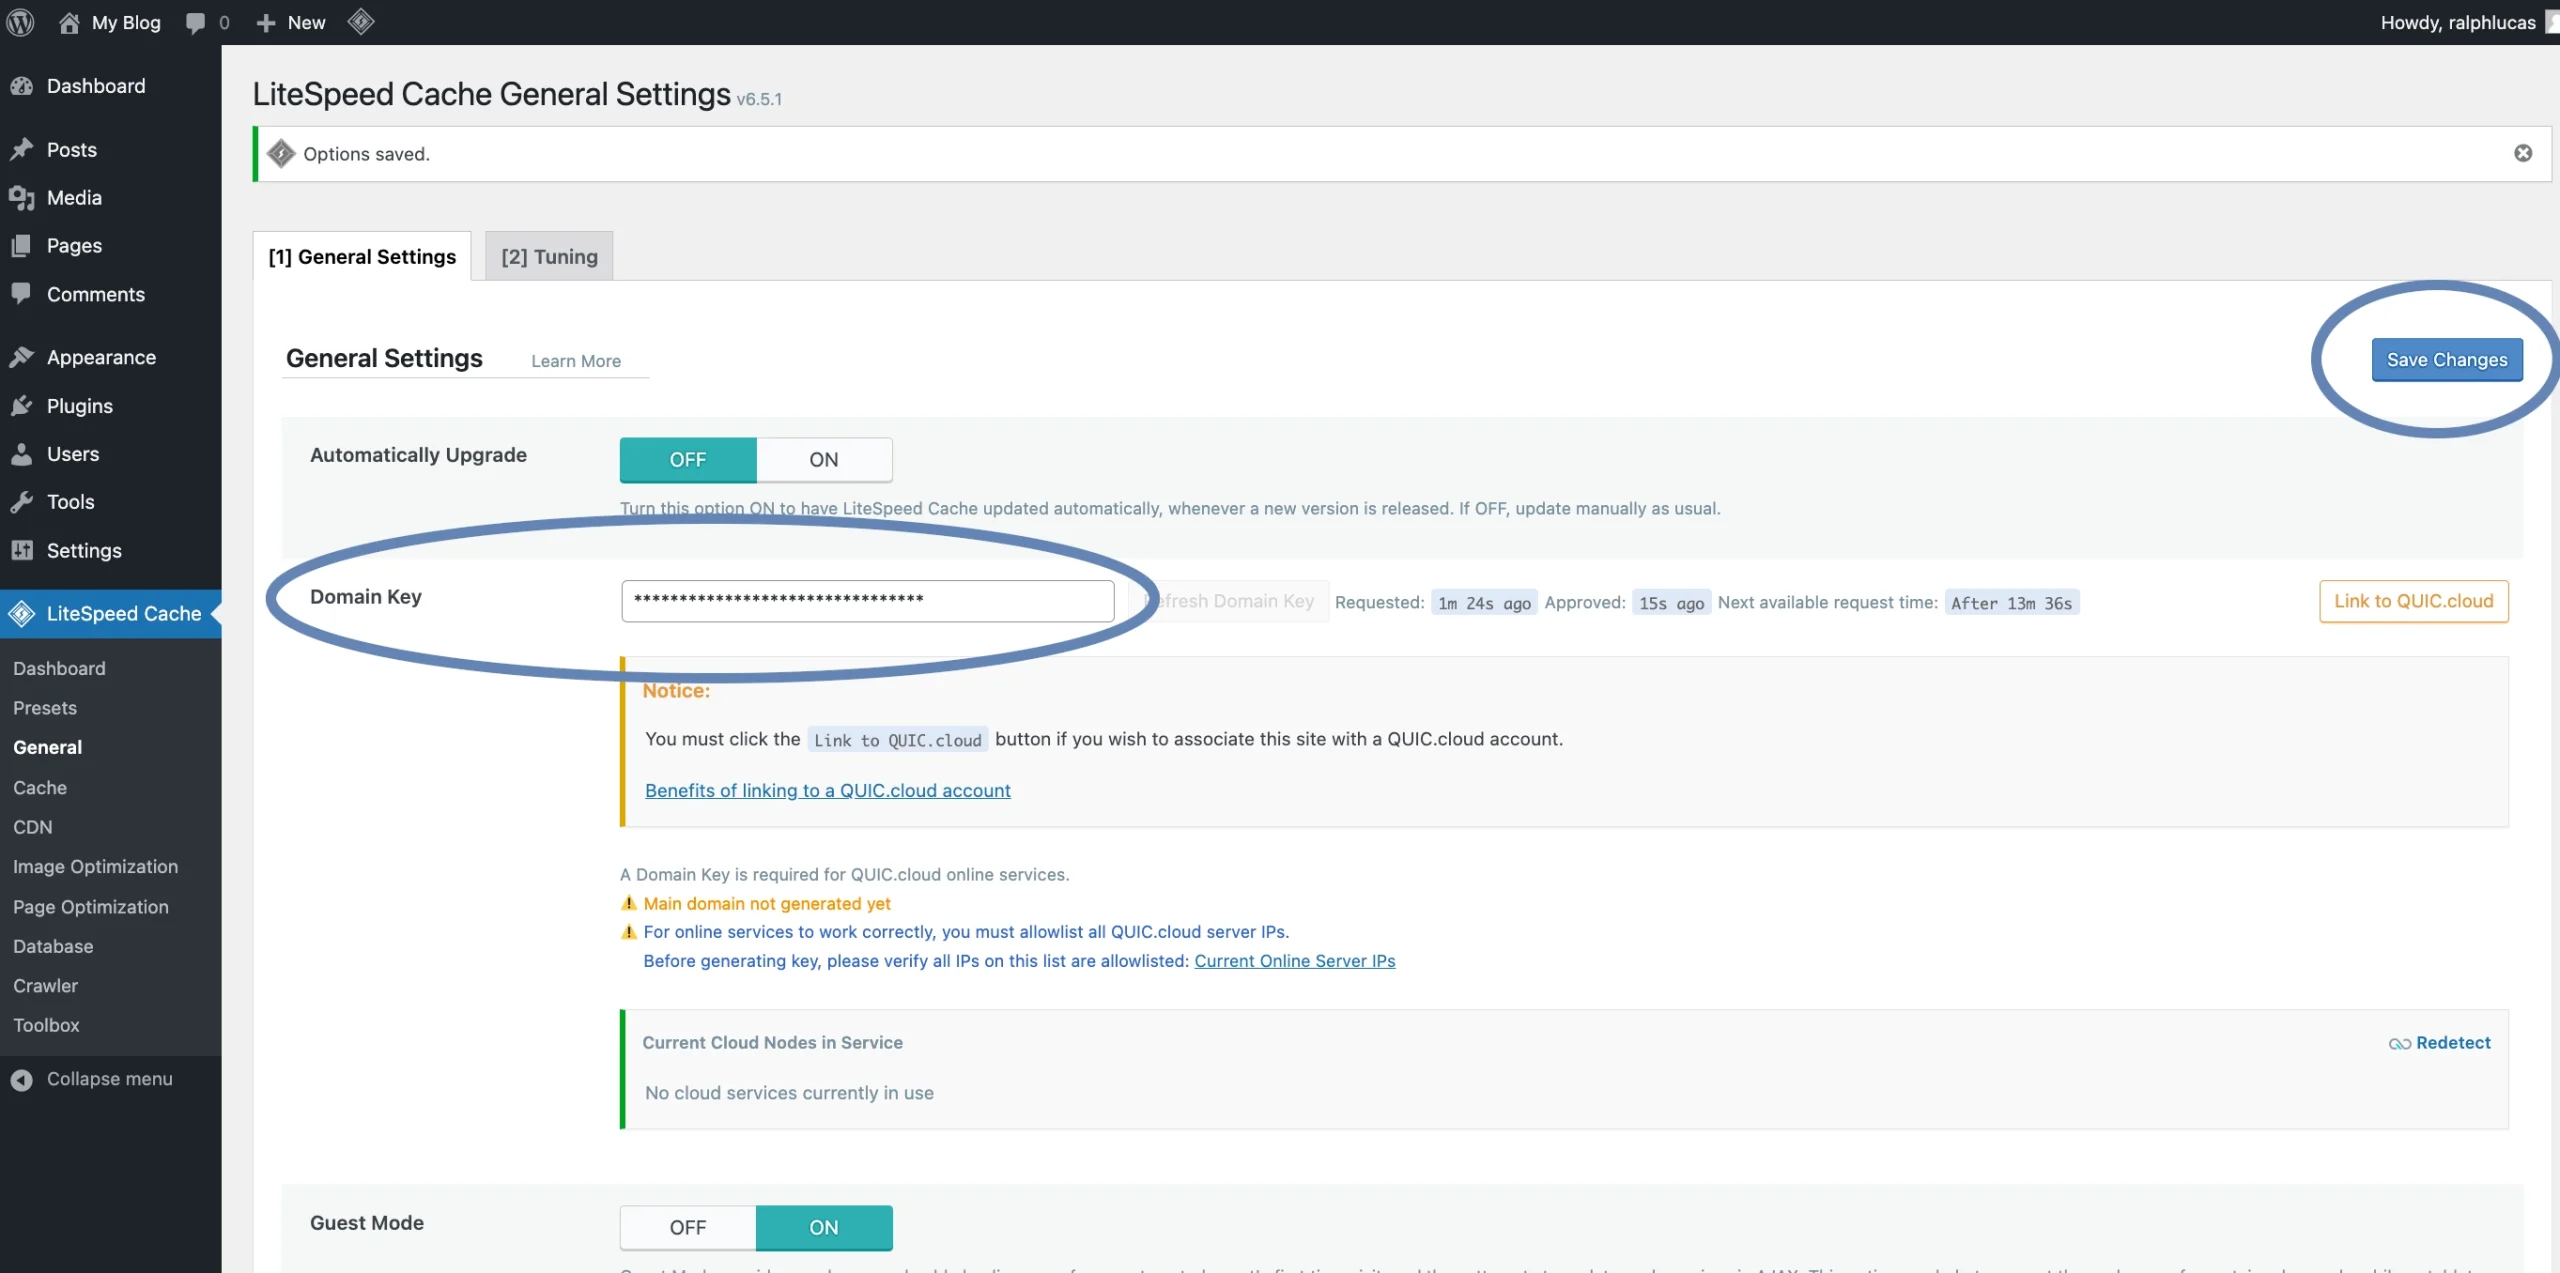
And finally, I’m going to request a domain key to connect to the quic.cloud. I do this by clicking on “general” on the left hand side, then clicking the “request domain key” button:
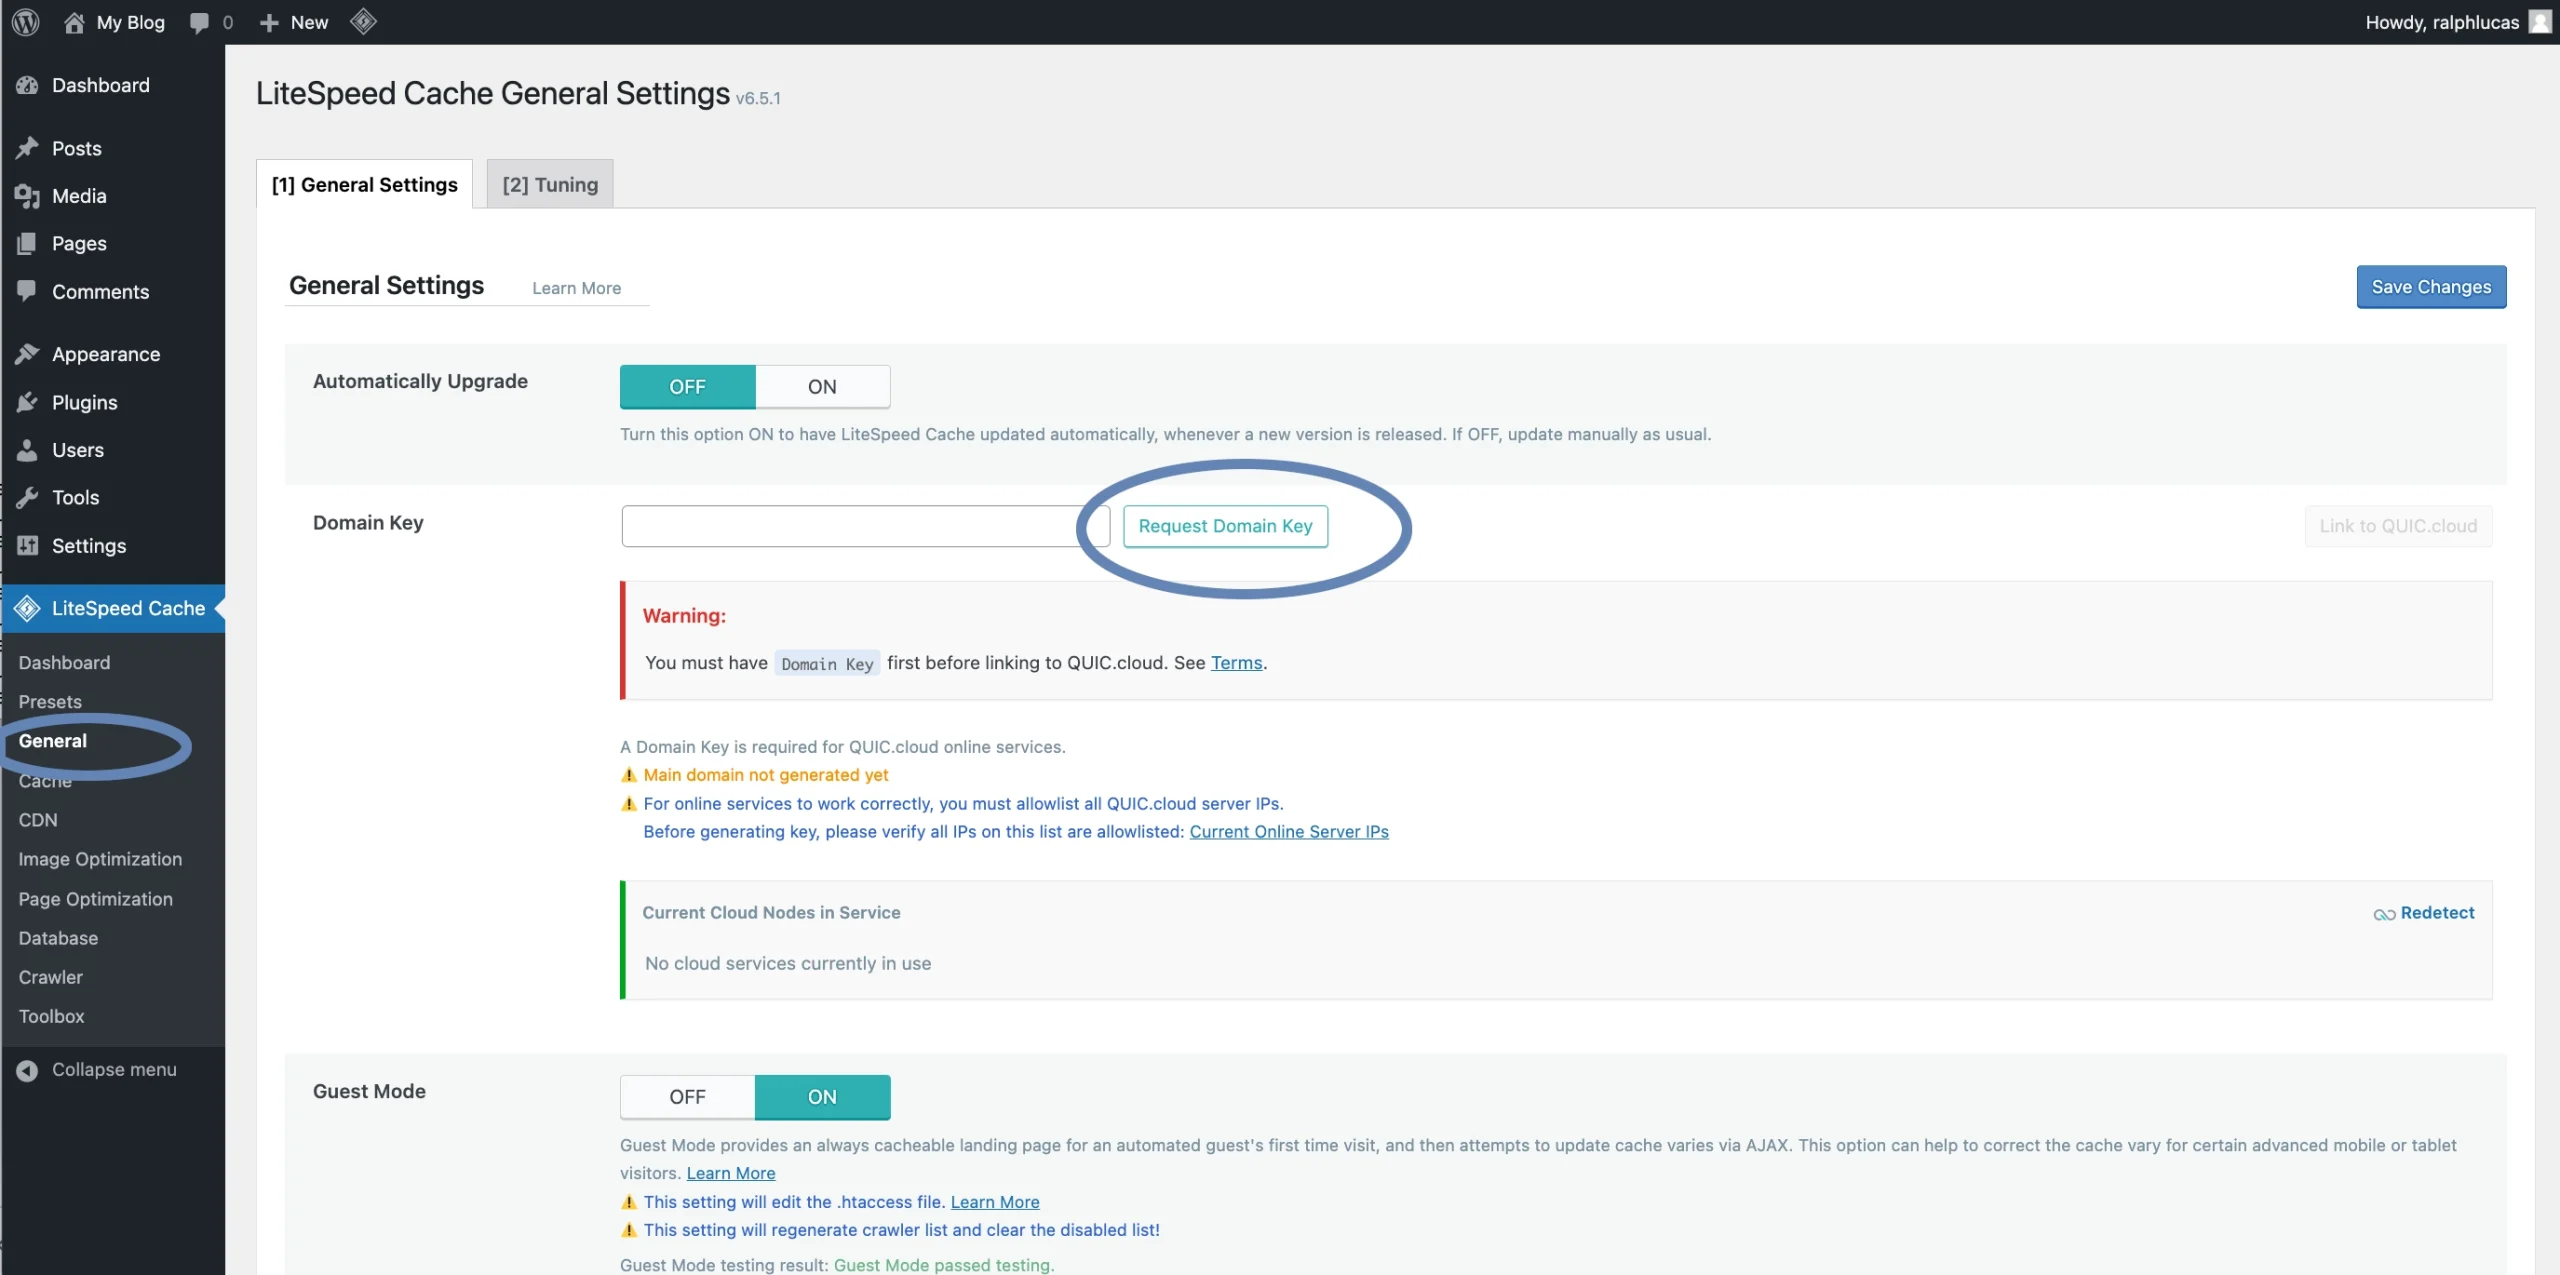
All I need to do then is wait a few minutes, and refresh the page. Once the “Domain Key” field is populated, I then save changes:
When I ran cPanel’s test to WordPress when the server was running Apache, I got an average of 1.4786 seconds.
When I ran cPanel’s test using JUST the Litespeed web server (no Litespeed cache plugin in WordPress) to WordPress I got an average of 0.8912 seconds.
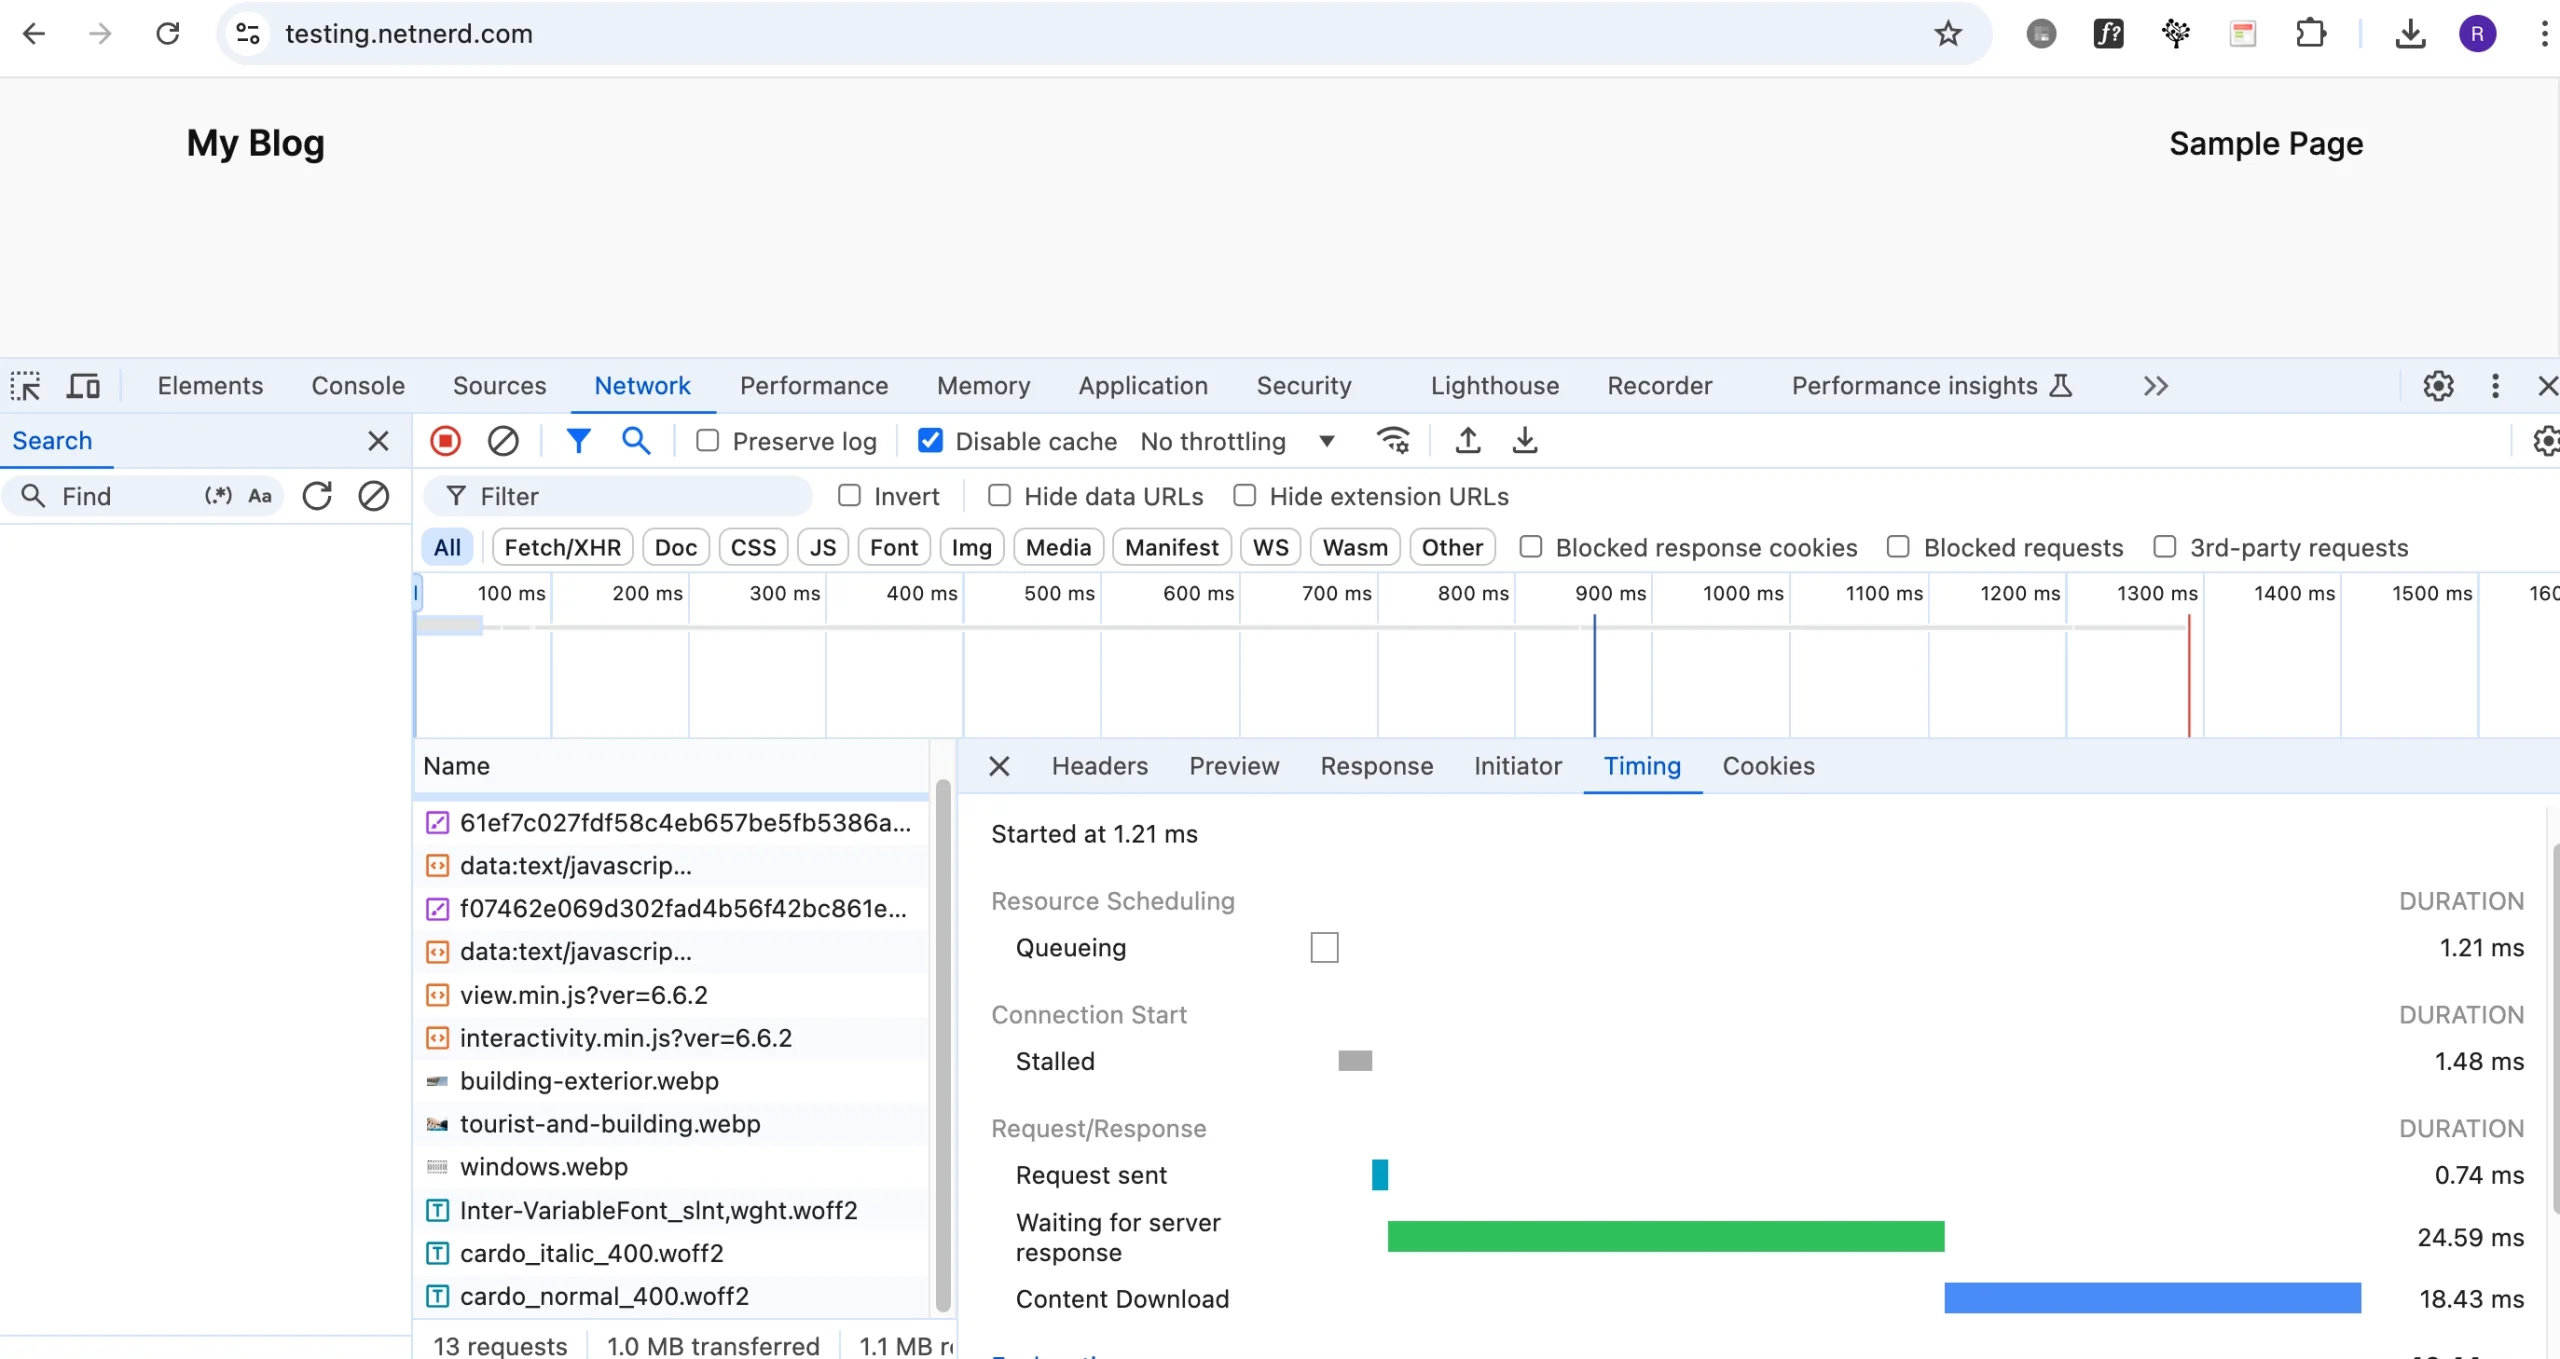
After installing and configuring the Litespeed Cache Plugin (as above), when I run cPanel’s test, I now get an average of 0.2132 seconds.
netnerd@NetNerds-MacBook-Pro .ssh % time curl -o /dev/null -silent –resolve testing.netnerd.com:443:185.229.21.103 https://testing.netnerd.com:443/
curl -o /dev/null -silent –resolve testing.netnerd.com:443:185.229.21.103 0.01s user 0.01s system 13% cpu 0.200 total
netnerd@NetNerds-MacBook-Pro .ssh % time curl -o /dev/null -silent –resolve testing.netnerd.com:443:185.229.21.103 https://testing.netnerd.com:443/
curl -o /dev/null -silent –resolve testing.netnerd.com:443:185.229.21.103 0.01s user 0.01s system 11% cpu 0.192 total
netnerd@NetNerds-MacBook-Pro .ssh % time curl -o /dev/null -silent –resolve testing.netnerd.com:443:185.229.21.103 https://testing.netnerd.com:443/
curl -o /dev/null -silent –resolve testing.netnerd.com:443:185.229.21.103 0.01s user 0.01s system 8% cpu 0.274 total
netnerd@NetNerds-MacBook-Pro .ssh % time curl -o /dev/null -silent –resolve testing.netnerd.com:443:185.229.21.103 https://testing.netnerd.com:443/
curl -o /dev/null -silent –resolve testing.netnerd.com:443:185.229.21.103 0.01s user 0.01s system 12% cpu 0.200 total
netnerd@NetNerds-MacBook-Pro .ssh % time curl -o /dev/null -silent –resolve testing.netnerd.com:443:185.229.21.103 https://testing.netnerd.com:443/
curl -o /dev/null -silent –resolve testing.netnerd.com:443:185.229.21.103 0.01s user 0.01s system 11% cpu 0.200 total
I’ll admit, this is probably a bit skewed because the WordPress installation I’m testing with is just a base WordPress install with no customisations, the default them, and no plugins other than Litespeed Cache, Akismet and Hello Dolly.
Nonetheless, by running this base WordPress installation on a server running the Litespeed web server and the litespeed cache plugin, I’ve reduced response times by about 75.6%, or around 1.2 seconds. When you consider that a “good” FCP time is under 2.5 seconds, 1.2 seconds is nearly half of this. That’s quite a saving, just from choosing the right kind of hosting.
In Conclusion.
In conclusion, you can make it a LOT easier to pass the time based metrics that make up parts of Core Web Vitals, when using WordPress, simply by using hosting that provides:
- The Litespeed web server
- Redis object cache
You can leverage these to a greater degree by using the Litespeed cache plugin, with a fairly simple preset configuration, object caching and a domain key.
You don’t have to spend a lot of money to obtain hosting that provides the above. You can obtain this type of web hosting for as little as £4.99 per month with our Unlimited hosting package. You can also get Litespeed based hosting free for a year with the purchase of a domain, when using our Essentials hosting as part of this offer that we’re currently running.